Daniocell
lrig3 (periderm)
leucine-rich repeats and immunoglobulin-like domains 3
ZFIN
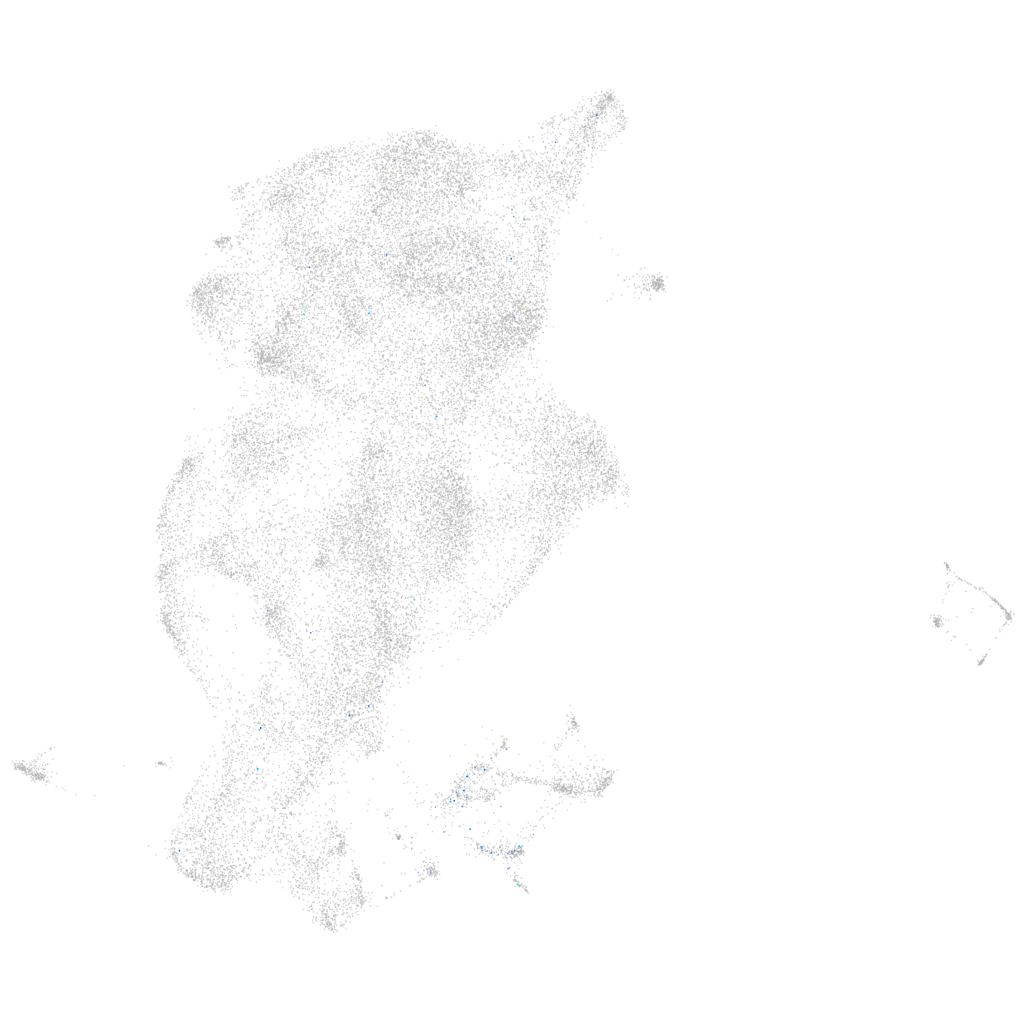
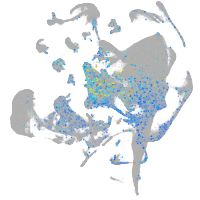
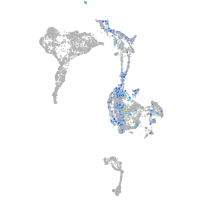
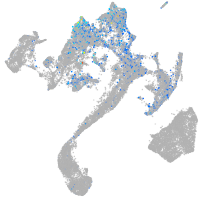
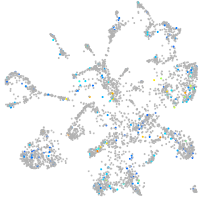
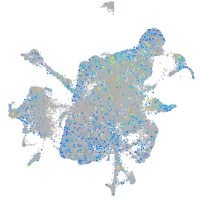
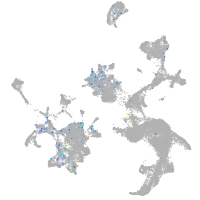
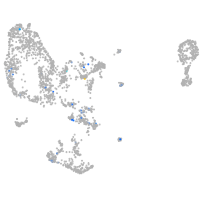
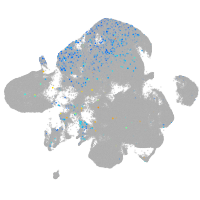
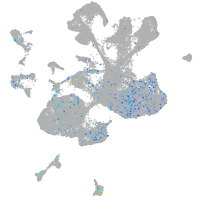
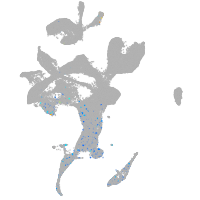
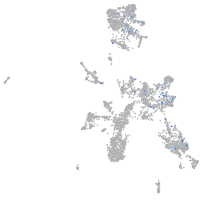
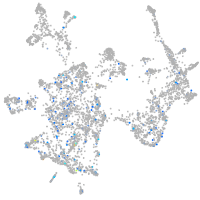
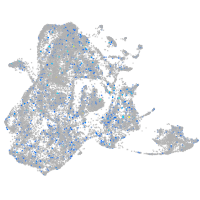
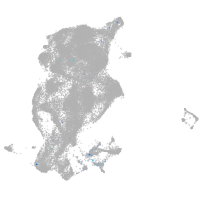
Gene expression UMAP
Display:
Expression
Stage
Other cell groups
all cells
blastomeres
PGCs
endoderm
axial mesoderm
muscle
mural cells /
non-skeletal muscle
mesenchyme
hematopoietic /
vasculature
pronephros
neural
spinal cord / glia
eye
taste / olfactory
otic / lateral line
epidermis
periderm
fin
ionocytes / mucous
pigment cells
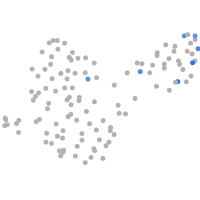
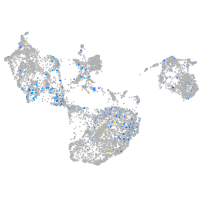
Expression by stage/cluster
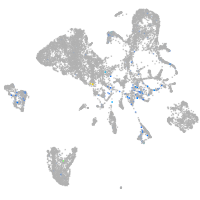
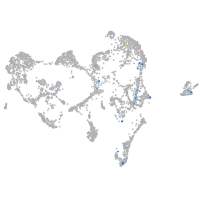
Correlated gene expression
Positive correlation
Negative correlation
Gene
r
Gene
r
FO704673.1
0.192
wu:fb18f06
-0.031
LOC100334612
0.186
zgc:193505
-0.030
chrna9
0.171
cyt1
-0.028
CU929444.1
0.146
si:ch211-195b11.3
-0.028
LOC103910575
0.144
krt4
-0.027
znf1042
0.130
krt5
-0.025
si:ch211-286o17.1
0.126
cfl1l
-0.022
mfap2
0.126
aldob
-0.021
LOC101886876
0.124
zgc:162730
-0.021
wnt5b
0.122
ckap4
-0.021
six1a
0.117
glo1
-0.021
si:busm1-266f07.2
0.117
tcnbb
-0.020
si:ch211-202p1.5
0.115
anxa1a
-0.019
BX324132.3
0.115
prr13
-0.019
igf2b
0.114
selenow1
-0.019
pmp22a
0.109
s100w
-0.019
cpb2
0.107
stx11b.1
-0.019
fgf18a
0.106
icn2
-0.018
cyp1c2
0.106
pycard
-0.018
fstl1b
0.104
ponzr3
-0.017
si:dkey-261h17.1
0.104
dhrs13a.2
-0.017
cryaba
0.103
mcl1a
-0.017
BX470116.1
0.102
cdc34a
-0.017
LOC110437713
0.101
s100a10b
-0.017
cpn1
0.101
pkp3a
-0.017
adamts10
0.100
ponzr4
-0.016
lix1
0.100
them6
-0.016
CR751602.2
0.100
cyt1l
-0.016
si:dkey-110g7.8
0.098
klf3
-0.016
zgc:110716
0.098
icn
-0.016
cd81a
0.098
capns1a
-0.015
BX248521.2
0.098
epdl1
-0.015
tmem176
0.097
ip6k2a
-0.015
si:ch73-380l3.2
0.097
agr1
-0.015
cnksr2a
0.097
scel
-0.015