
LIM homeobox 9
ZFIN 
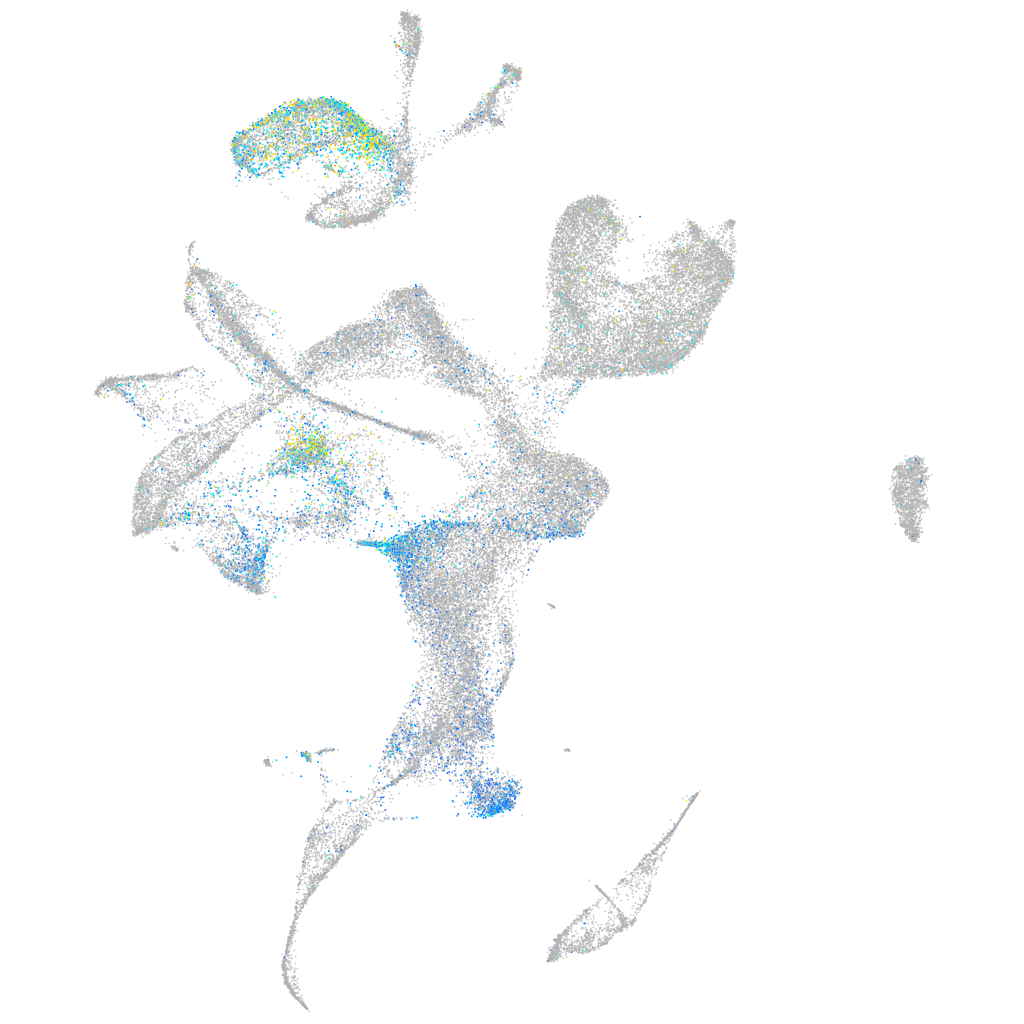
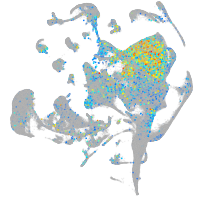
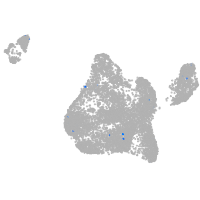
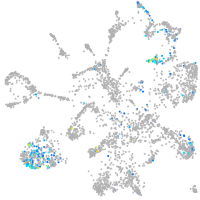
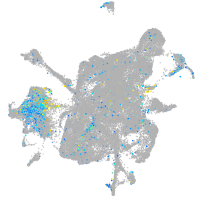
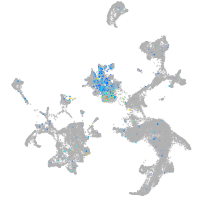
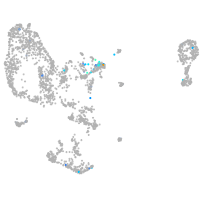
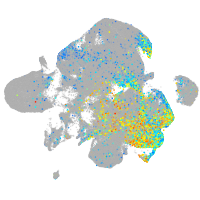
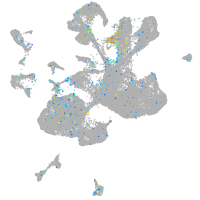
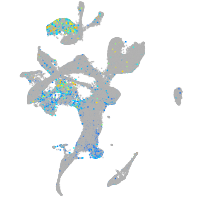
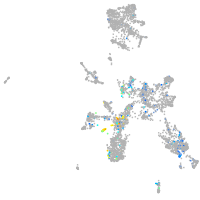
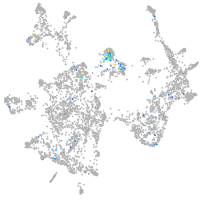
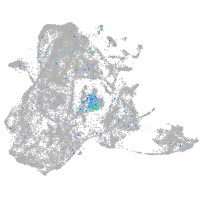
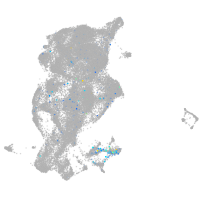
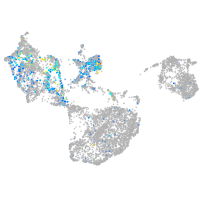
Gene expression UMAP


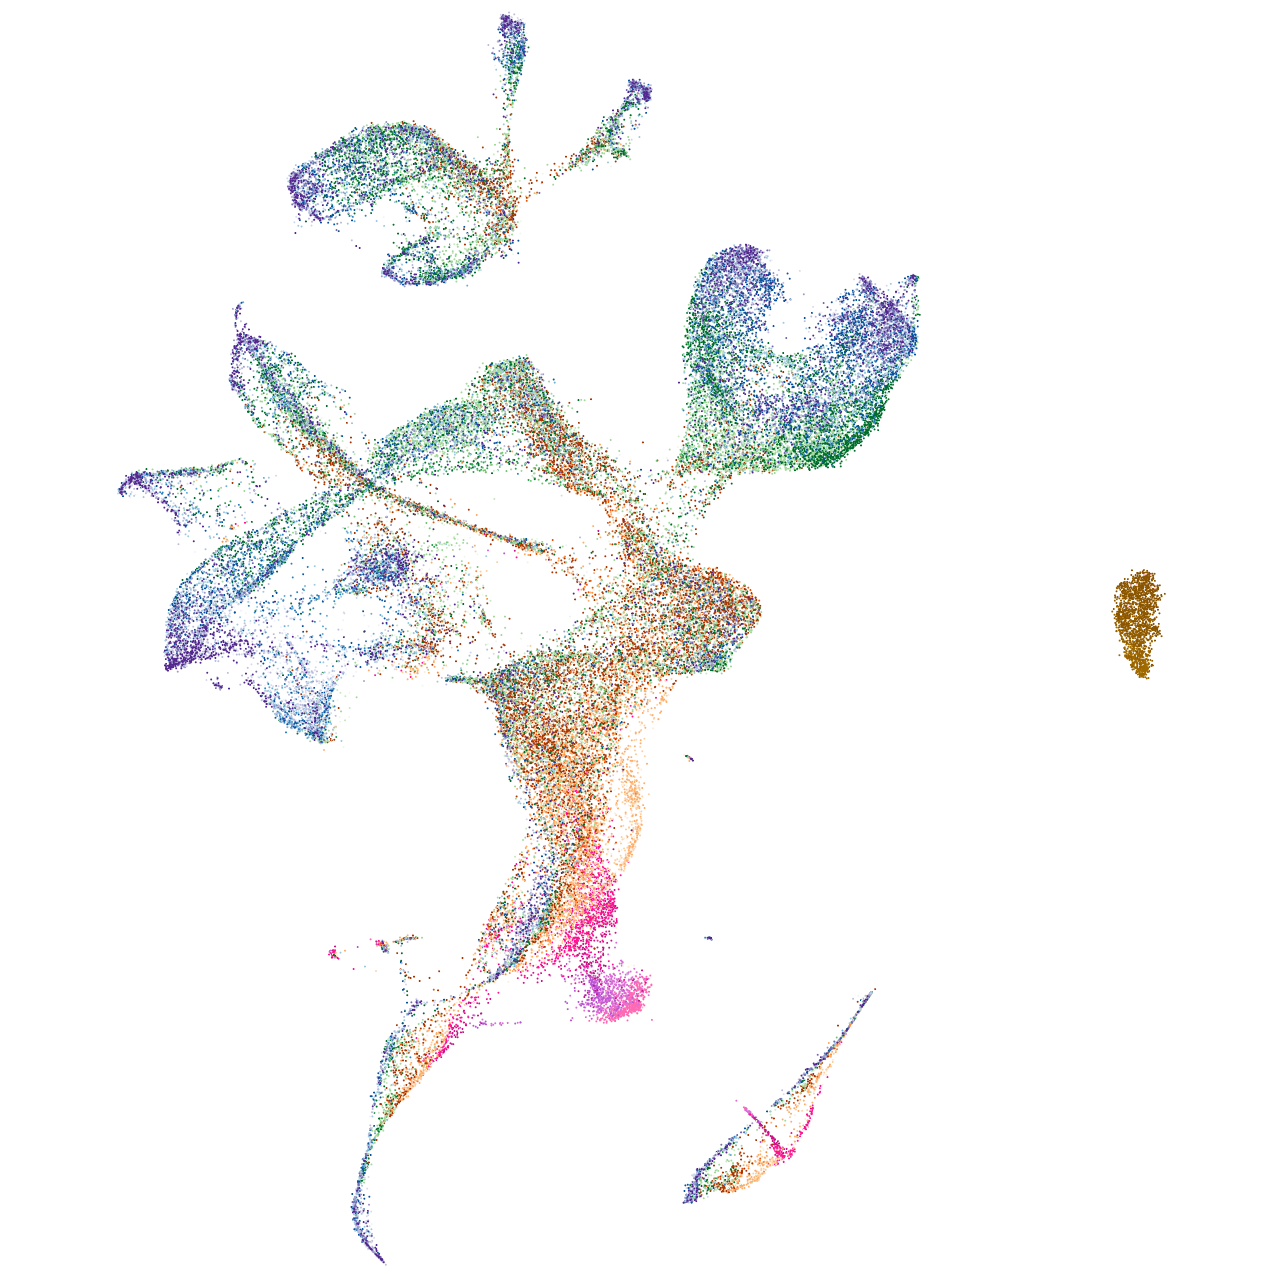

Expression by stage/cluster
Correlated gene expression
| Positive correlation | Negative correlation | ||
| Gene | r | Gene | r |
| meis2b | 0.324 | hmgb2a | -0.117 |
| pax10 | 0.310 | anp32e | -0.107 |
| gbx2 | 0.263 | syt5b | -0.101 |
| elavl3 | 0.240 | otx5 | -0.097 |
| tfap2c | 0.233 | crx | -0.095 |
| tfap2e | 0.224 | rs1a | -0.081 |
| mab21l1 | 0.214 | neurod4 | -0.081 |
| tfap2a | 0.211 | stmn1a | -0.076 |
| pbx1a | 0.202 | gng13b | -0.071 |
| meis2a | 0.201 | atp2b1b | -0.071 |
| lhx2b | 0.201 | histh1l | -0.069 |
| barhl2 | 0.198 | ddah2 | -0.067 |
| lmo4b | 0.192 | ndrg1b | -0.066 |
| celf2 | 0.188 | samsn1a | -0.066 |
| slc32a1 | 0.182 | stxbp1b | -0.065 |
| tbx3a | 0.180 | pcna | -0.064 |
| sox4a | 0.180 | tulp1a | -0.064 |
| tfap2b | 0.179 | neurod1 | -0.064 |
| celf5a | 0.178 | ppdpfa | -0.063 |
| mir181b-3 | 0.174 | msi1 | -0.063 |
| mab21l2 | 0.170 | ccnd1 | -0.062 |
| tubb5 | 0.170 | eef1da | -0.062 |
| bhlhe22 | 0.165 | cplx4a | -0.062 |
| stmn1b | 0.164 | gnb3a | -0.061 |
| zgc:165604 | 0.164 | chaf1a | -0.061 |
| gpr37a | 0.164 | isl1 | -0.059 |
| tspan18b | 0.163 | LOC103909376 | -0.059 |
| olfm2a | 0.162 | lig1 | -0.059 |
| rbfox2 | 0.159 | stx3a | -0.058 |
| LOC101886114 | 0.157 | six7 | -0.058 |
| meis1b | 0.157 | pcp4l1 | -0.057 |
| hmgb3a | 0.157 | nexn | -0.057 |
| ppp1r14ba | 0.156 | dut | -0.057 |
| nrp1a | 0.156 | nrn1lb | -0.057 |
| pbx3b | 0.156 | zgc:109965 | -0.057 |