Daniocell
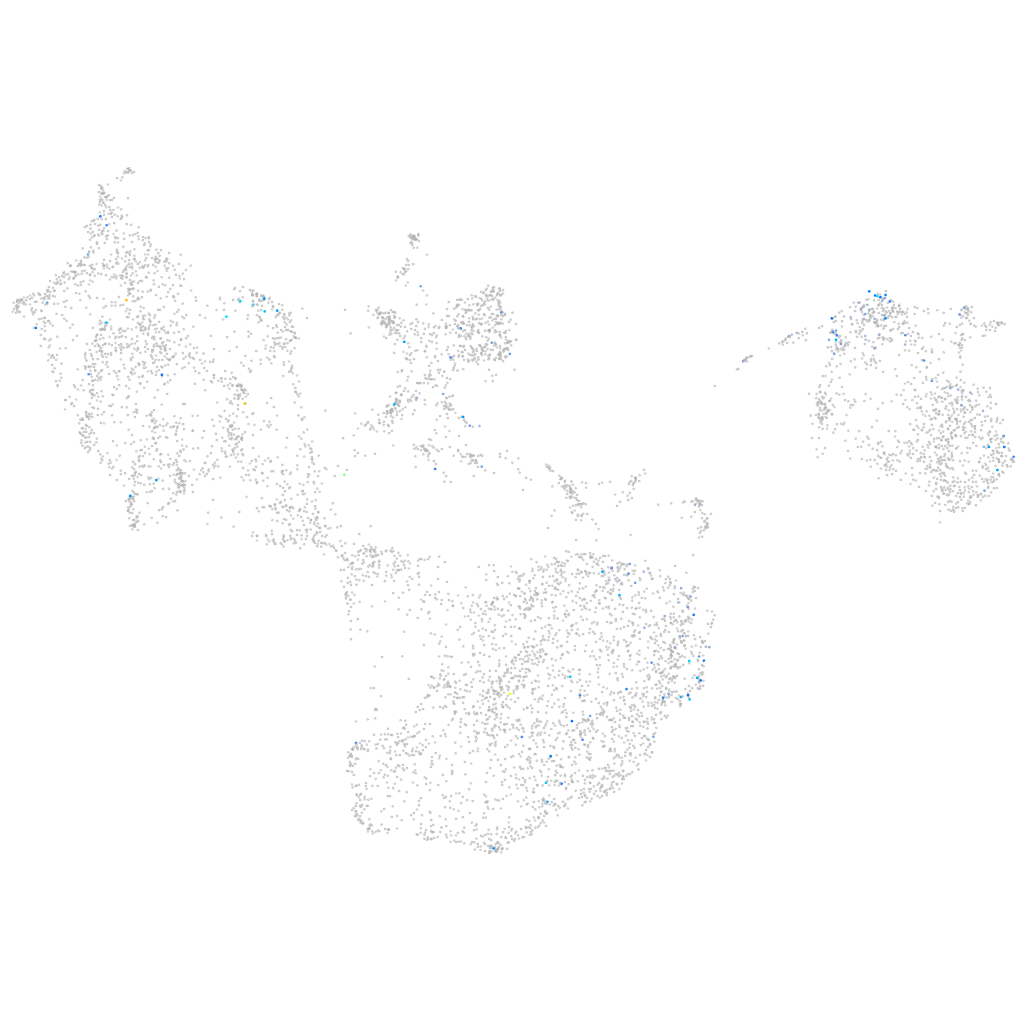
LOC101882334 (fin)
Gene expression UMAP
Display:
Expression
Stage
Other cell groups
all cells
blastomeres
PGCs
endoderm
axial mesoderm
muscle
mural cells /
non-skeletal muscle
mesenchyme
hematopoietic /
vasculature
pronephros
neural
spinal cord / glia
eye
taste / olfactory
otic / lateral line
epidermis
periderm
fin
ionocytes / mucous
pigment cells
Expression by stage/cluster
Correlated gene expression
Positive correlation
Negative correlation
Gene
r
Gene
r
si:ch211-214j24.15
0.207
mt-atp6
-0.081
CU466278.1
0.172
mt-nd1
-0.071
CU929359.2
0.164
fkbp9
-0.067
LOC103910395
0.154
tubb2b
-0.065
CT573157.1
0.153
mt-cyb
-0.064
sc:d189
0.141
fkbp1aa
-0.061
LOC101885494
0.140
calm2b
-0.061
nrbf2a
0.135
erh
-0.059
LOC101885868
0.131
ostc
-0.058
crygm2d8
0.127
hmgn6
-0.056
esrrb
0.114
sub1a
-0.056
si:ch211-276i12.4
0.114
si:ch73-46j18.5
-0.056
CABZ01088346.1
0.113
idh2
-0.056
mgat4c
0.112
tmem258
-0.055
LOC103909465
0.112
h2afvb
-0.055
zgc:136930
0.112
hmga1a
-0.055
chrna1
0.111
tnc
-0.055
CR936321.1
0.107
dad1
-0.055
rttn
0.107
clta
-0.055
LOC110439983
0.106
GCA
-0.055
il17d
0.106
h3f3a
-0.055
CU693368.1
0.106
calr3b
-0.054
si:ch73-368j24.14
0.106
kdelr2a
-0.054
eif4ebp3
0.106
ppib
-0.054
si:dkey-183i3.5
0.104
slc39a7
-0.054
CABZ01041604.1
0.103
snrpe
-0.053
XLOC-033512
0.102
ssr4
-0.053
rnf139
0.102
asph
-0.052
CR762436.2
0.101
tma7
-0.052
kncn
0.101
srsf3b
-0.052
LOC101885813
0.101
rhoaa
-0.052
LOC101885920
0.101
psmb6
-0.052
bbs1
0.100
arf5
-0.051
sccpdha
0.098
egfl6
-0.051
si:dkey-261m9.9
0.098
ctnnb1
-0.051