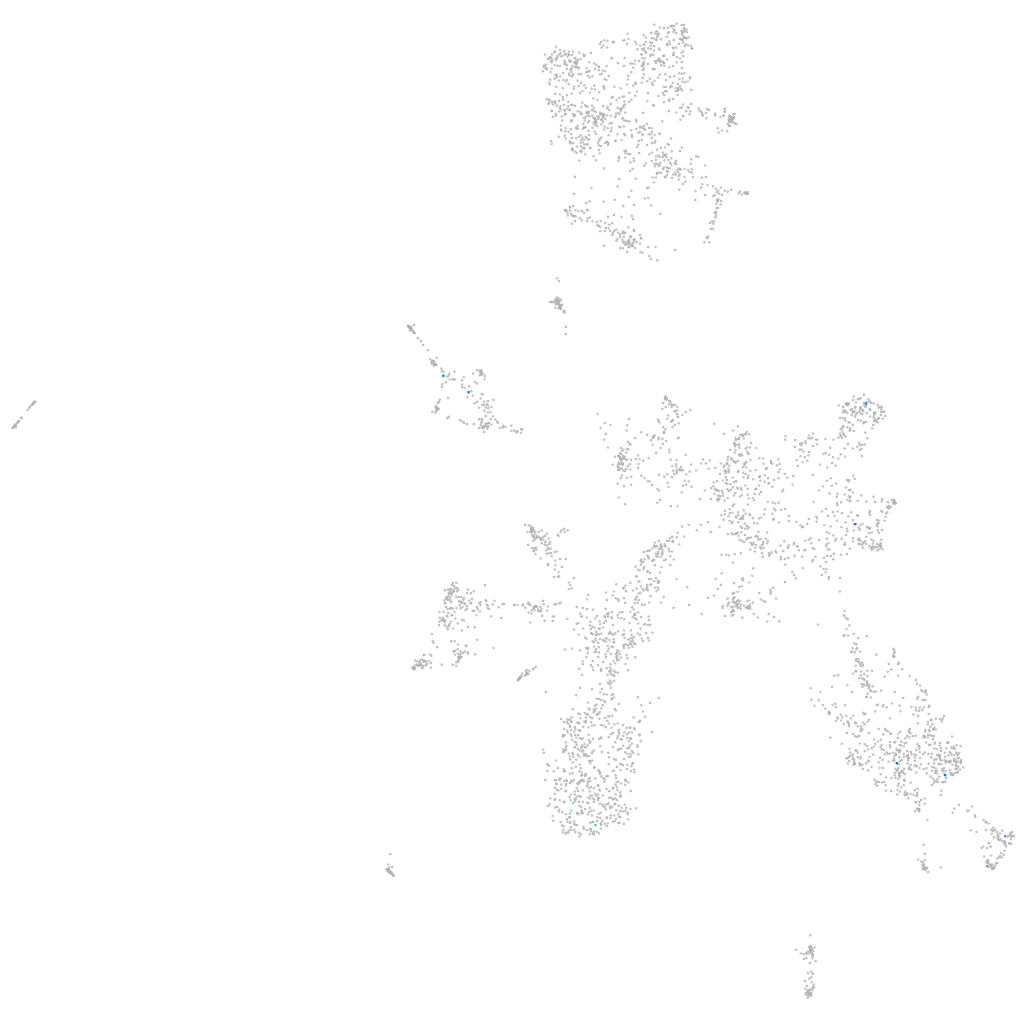
Daniocell
LOC101882334 (taste / olfactory)
Gene expression UMAP
Display:
Expression
Stage
Other cell groups
all cells
blastomeres
PGCs
endoderm
axial mesoderm
muscle
mural cells /
non-skeletal muscle
mesenchyme
hematopoietic /
vasculature
pronephros
neural
spinal cord / glia
eye
taste / olfactory
otic / lateral line
epidermis
periderm
fin
ionocytes / mucous
pigment cells
Expression by stage/cluster
Correlated gene expression
Positive correlation
Negative correlation
Gene
r
Gene
r
si:dkey-51d8.1
0.518
uba52
-0.047
lrrc10b
0.432
cfl1
-0.044
CABZ01066320.2
0.396
rpl9
-0.042
pstpip1a
0.375
tmem258
-0.041
XLOC-033024
0.359
ptmab
-0.040
LOC110437996
0.323
rpl13a
-0.038
ctxn2
0.314
ywhaz
-0.037
ugt5c2
0.292
eef1a1l1
-0.037
cers4a
0.292
atp5f1e
-0.037
LO018250.1
0.285
gdi1
-0.036
FQ378016.1
0.281
cldn7b
-0.036
loxl4
0.273
marcksl1b
-0.035
zgc:136333
0.260
si:ch73-1a9.3
-0.035
CR392036.1
0.250
rpl18a
-0.034
CABZ01054509.1
0.236
sub1a
-0.034
myh7bb
0.235
si:ch211-137a8.4
-0.034
zgc:113057
0.230
fkbp1aa
-0.034
XLOC-043372
0.230
jpt1b
-0.033
or115-13
0.228
rps15
-0.033
nxph3
0.225
rplp1
-0.032
nlrc9
0.219
srsf3b
-0.032
si:dkey-111e8.4
0.216
h3f3c
-0.032
FP103009.1
0.215
h3f3a
-0.032
BX005228.1
0.211
ostc
-0.032
or115-14
0.209
ywhah
-0.031
or132-4
0.206
apex1
-0.031
LOC101883229
0.205
myef2
-0.031
st6galnac5a
0.205
smarca4a
-0.031
dcst2
0.204
elavl3
-0.030
LOC108192083
0.204
eef1b2
-0.030
henmt1
0.191
eef2b
-0.030
LOC108181471
0.189
rps20
-0.030
LOC110439352
0.186
cct5
-0.030
onecut3b
0.183
rpl23
-0.030
si:ch211-1e14.1
0.182
si:dkey-28b4.7
-0.030