Daniocell
kctd15a (taste / olfactory)
potassium channel tetramerization domain containing 15a
ZFIN
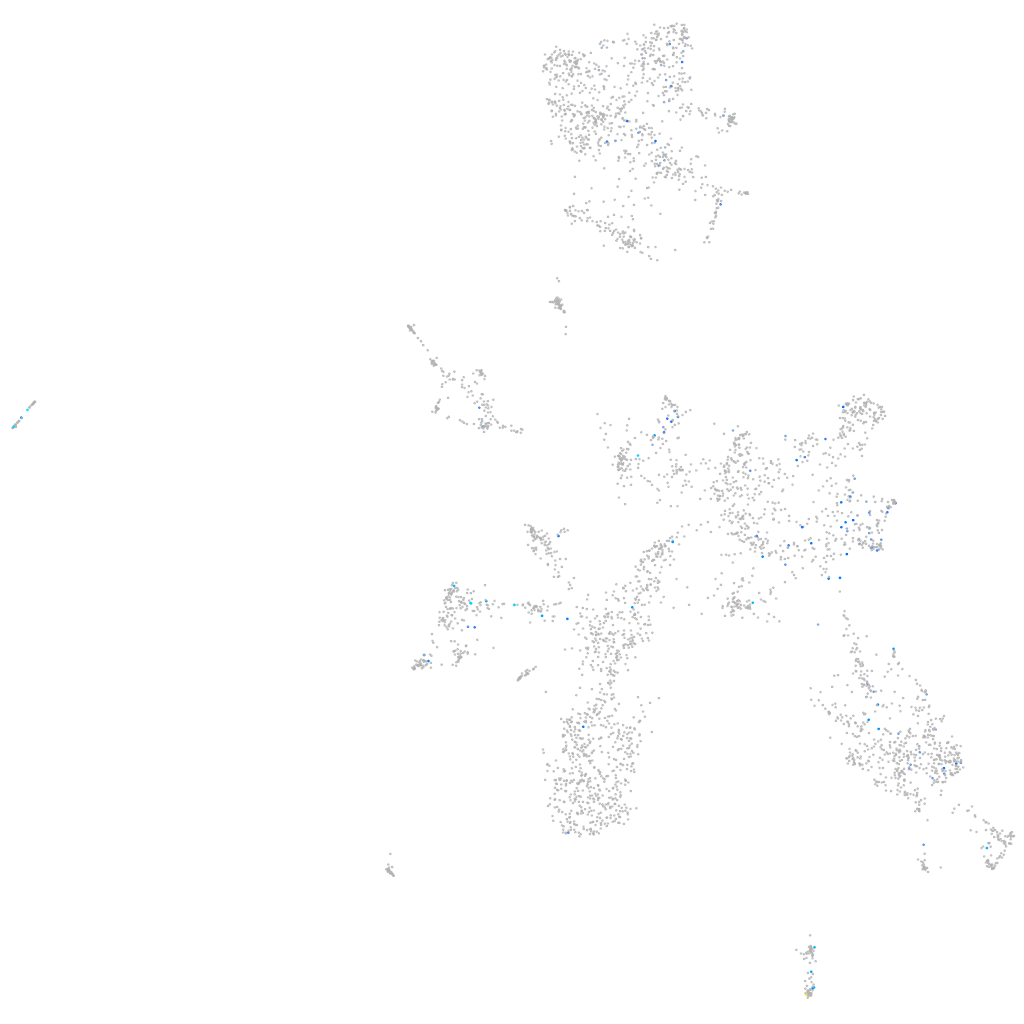
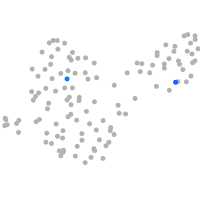
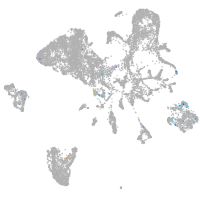
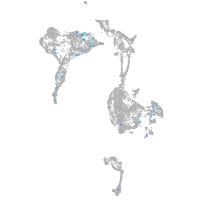
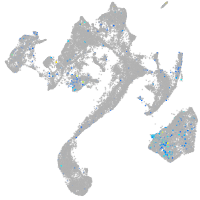
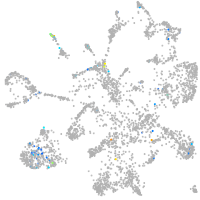
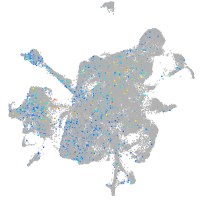
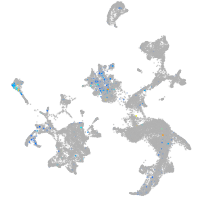
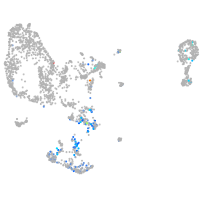
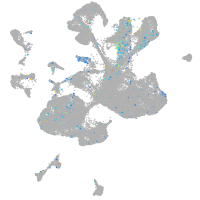
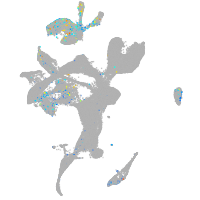
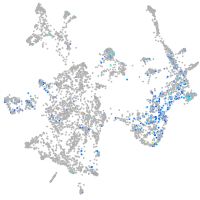
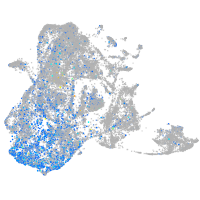
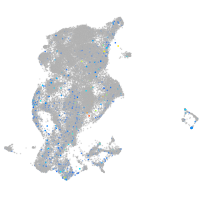
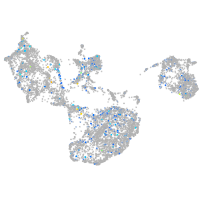
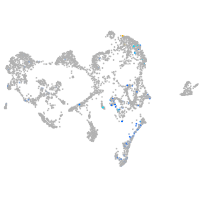
Gene expression UMAP
Display:
Expression
Stage
Other cell groups
all cells
blastomeres
PGCs
endoderm
axial mesoderm
muscle
mural cells /
non-skeletal muscle
mesenchyme
hematopoietic /
vasculature
pronephros
neural
spinal cord / glia
eye
taste / olfactory
otic / lateral line
epidermis
periderm
fin
ionocytes / mucous
pigment cells
Expression by stage/cluster
Correlated gene expression
Positive correlation
Negative correlation
Gene
r
Gene
r
synpr
0.264
selenow1
-0.058
BX927377.1
0.183
icn
-0.054
tcn2
0.178
ponzr6
-0.050
mmp25b
0.173
prss23
-0.049
pdzph1
0.173
gadd45ab
-0.048
LOC108179792
0.166
lsr
-0.048
si:ch211-284e13.14
0.166
prss59.2
-0.047
htra4
0.160
gbgt1l3
-0.047
agtrap
0.156
tprg1
-0.047
LOC110438971.1
0.154
si:dkey-87o1.2
-0.046
nuak1a
0.142
ucp2
-0.046
AL928707.3
0.141
selenow2b
-0.045
shank2
0.141
eml2
-0.044
XLOC-033414
0.140
prss1
-0.044
BX537162.1
0.140
LOC100536671
-0.044
si:dkey-63b1.1
0.138
eps8l2
-0.043
hrh1
0.136
gng13a
-0.043
CU929458.1
0.136
ero1b
-0.042
GPR62 (1 of many)
0.136
rbms2a
-0.042
chrna6
0.136
si:ch73-234b20.5
-0.042
ddhd2
0.136
spint2
-0.042
admp
0.135
mvp
-0.042
XLOC-022129
0.133
nrcama
-0.042
XLOC-013081
0.130
calm1b
-0.041
zgc:171779
0.129
LOC103909115
-0.041
BX927130.4
0.128
zgc:66484
-0.041
zgc:91999
0.128
zgc:123295
-0.041
LOC101882525
0.126
slc2a1b
-0.040
si:ch211-232d10.3
0.126
vill
-0.040
opn5
0.125
zgc:158412
-0.040
LOC103911913
0.125
fryl
-0.040
tlx2
0.125
ppp1r11
-0.040
LO018022.2
0.125
capgb
-0.040
gb:cr929477
0.122
rgs1
-0.040
si:dkeyp-73a2.2
0.120
CELA1 (1 of many)
-0.040