
kalirin RhoGEF kinase a
ZFIN 
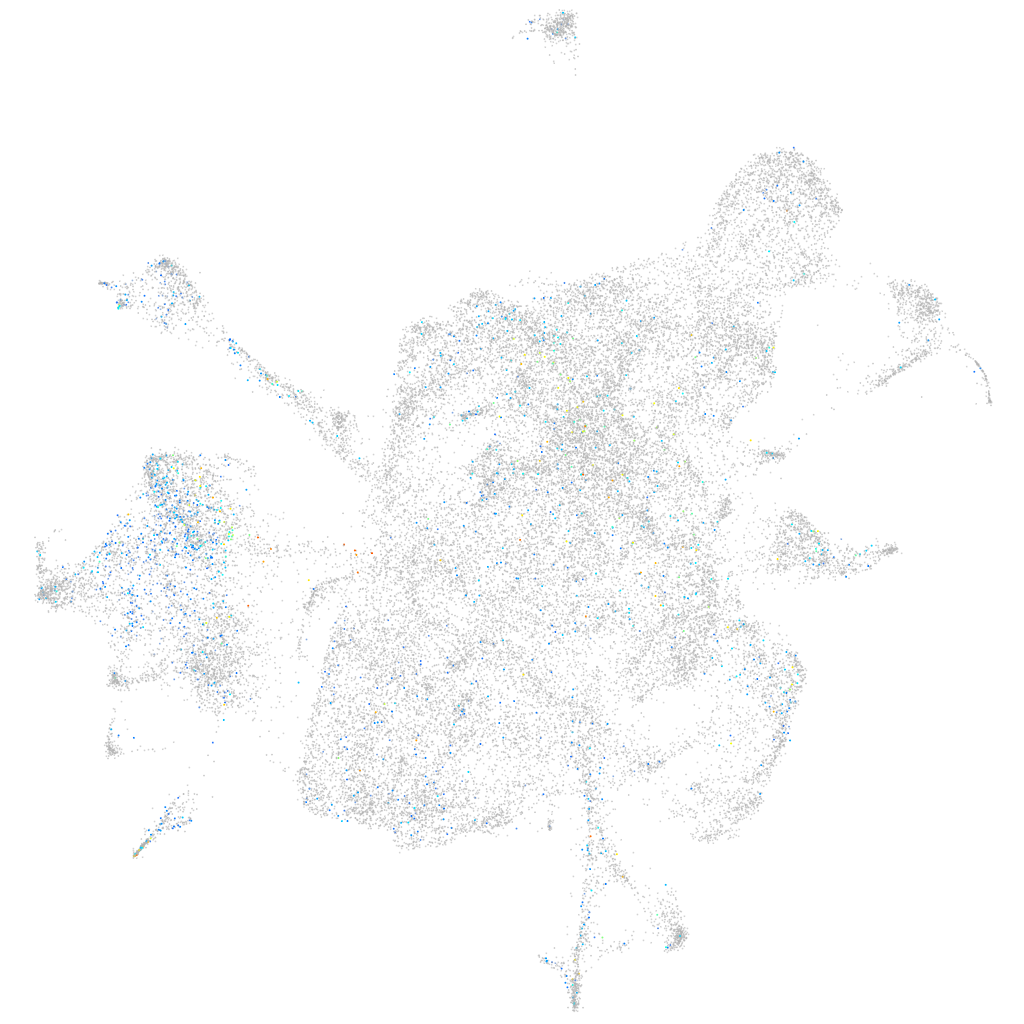
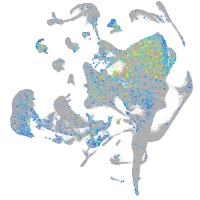
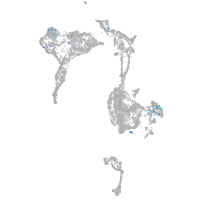
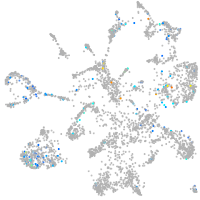
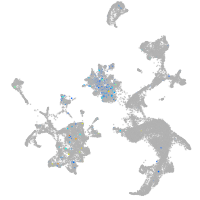
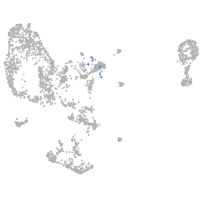
Gene expression UMAP


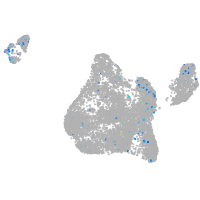
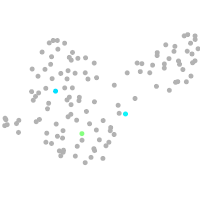


Expression by stage/cluster
Correlated gene expression
| Positive correlation | Negative correlation | ||
| Gene | r | Gene | r |
| stmn1b | 0.125 | rplp1 | -0.058 |
| elavl3 | 0.121 | si:dkey-151g10.6 | -0.057 |
| rtn1a | 0.121 | rplp2l | -0.056 |
| gpm6aa | 0.113 | rps29 | -0.050 |
| gpm6ab | 0.111 | rps19 | -0.046 |
| tuba1c | 0.111 | rps4x | -0.046 |
| rtn1b | 0.110 | rpl12 | -0.046 |
| tmsb | 0.107 | rpl37 | -0.045 |
| fez1 | 0.102 | rps24 | -0.043 |
| gng3 | 0.102 | rpl38 | -0.042 |
| nova2 | 0.100 | npm1a | -0.042 |
| tmsb2 | 0.095 | rpl26 | -0.042 |
| ckbb | 0.094 | rps12 | -0.042 |
| sncb | 0.092 | rps15a | -0.041 |
| gabrb4 | 0.092 | rpl10 | -0.041 |
| mllt11 | 0.092 | rpl23 | -0.041 |
| vamp2 | 0.090 | rpl7a | -0.041 |
| elavl4 | 0.089 | fgfbp2b | -0.040 |
| myt1la | 0.088 | rpl29 | -0.040 |
| olfm1b | 0.087 | rpl10a | -0.040 |
| celf2 | 0.086 | rps28 | -0.040 |
| stmn2a | 0.086 | rpl13 | -0.039 |
| ywhag2 | 0.085 | rpl39 | -0.039 |
| tuba1a | 0.085 | rpl36a | -0.039 |
| stx1b | 0.084 | rps27a | -0.039 |
| si:ch211-137a8.4 | 0.084 | rps2 | -0.038 |
| lmo3 | 0.083 | rpl11 | -0.038 |
| rnasekb | 0.082 | sox9a | -0.038 |
| tuba2 | 0.081 | rpl27 | -0.038 |
| snap25a | 0.081 | rps20 | -0.038 |
| sox4a | 0.081 | col9a2 | -0.037 |
| csdc2a | 0.080 | col9a3 | -0.037 |
| celf3a | 0.080 | rps10 | -0.036 |
| fam49al | 0.079 | rps13 | -0.036 |
| gap43 | 0.079 | rpl18a | -0.036 |