Daniocell
isg20l2 (glial cells / spinal cord)
interferon stimulated exonuclease gene 20-like 2
ZFIN
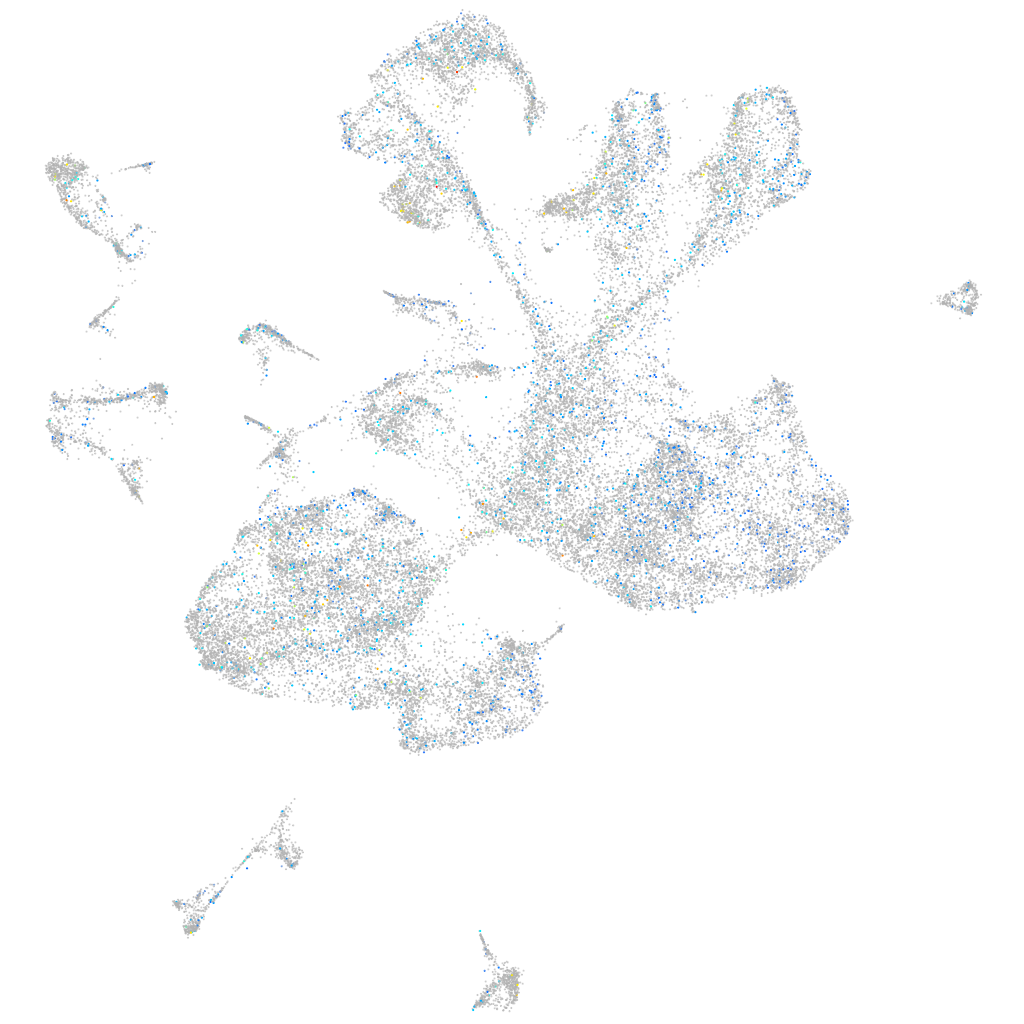
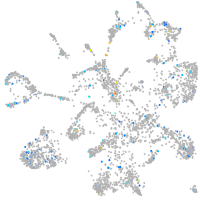
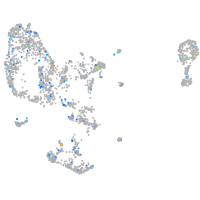
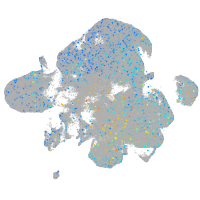
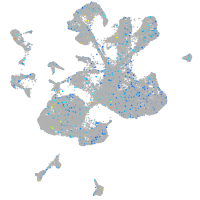
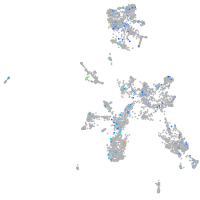
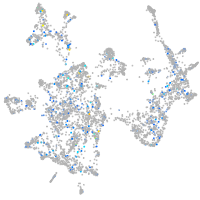
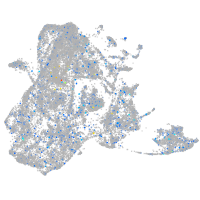
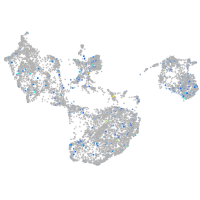
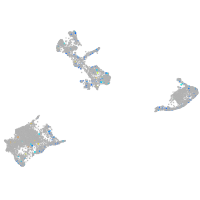
Gene expression UMAP
Display:
Expression
Stage
Other cell groups
all cells
blastomeres
PGCs
endoderm
axial mesoderm
muscle
mural cells /
non-skeletal muscle
mesenchyme
hematopoietic /
vasculature
pronephros
neural
spinal cord / glia
eye
taste / olfactory
otic / lateral line
epidermis
periderm
fin
ionocytes / mucous
pigment cells
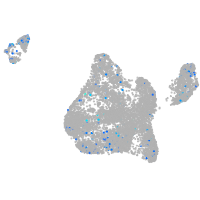
Expression by stage/cluster
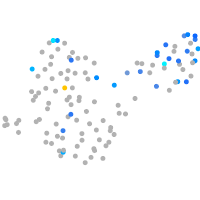
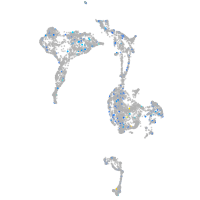
Correlated gene expression
Positive correlation
Negative correlation
Gene
r
Gene
r
LOC100334677
0.037
wnt4a
-0.018
XLOC-016189
0.036
apela
-0.018
CR376748.1
0.036
NC-002333.17
-0.017
taar10
0.035
XLOC-001964
-0.017
zgc:171695
0.035
CABZ01075068.1
-0.016
nags
0.034
selenoh
-0.016
XLOC-001638
0.033
eif4ebp3l
-0.016
si:dkey-42l23.2
0.032
ldlrad2
-0.016
LOC110438424
0.032
zgc:162939
-0.015
CR381700.1
0.032
BX001014.2
-0.015
HTRA2 (1 of many).9
0.032
aldob
-0.015
rock2bl
0.032
stmn1a
-0.015
mhc1lda
0.032
znfl2a
-0.015
si:ch73-359m17.11
0.031
XLOC-042899
-0.015
CR762407.2
0.031
nasp
-0.015
BX649423.1
0.031
ptgr1
-0.015
ywhah
0.031
orc4
-0.015
XLOC-044324
0.031
wdhd1
-0.014
rh50
0.030
foxa
-0.014
BX255913.2
0.030
cdx4
-0.014
pip4k2ab
0.030
dut
-0.014
gnb1a
0.030
rrm1
-0.014
LOC101882848
0.030
anks4b
-0.014
gatad2b
0.030
si:ch211-286o17.1
-0.014
LO018022.2
0.030
zgc:110540
-0.014
si:ch73-144l3.1
0.030
chaf1a
-0.014
RF00273
0.030
clint1a
-0.014
si:ch211-214j24.9
0.030
pias2
-0.014
XLOC-010093
0.029
gdf6b
-0.014
LOC110438056
0.029
paxip1
-0.014
camk2g1
0.029
rrm2
-0.013
coro1b
0.029
slc1a3a
-0.013
hmgb3a
0.029
edn1
-0.013
jpt1b
0.029
myom1b
-0.013
XLOC-032243
0.029
gins2
-0.013