Daniocell
ice1 (pigment cells)
KIAA0947-like (H. sapiens)
ZFIN
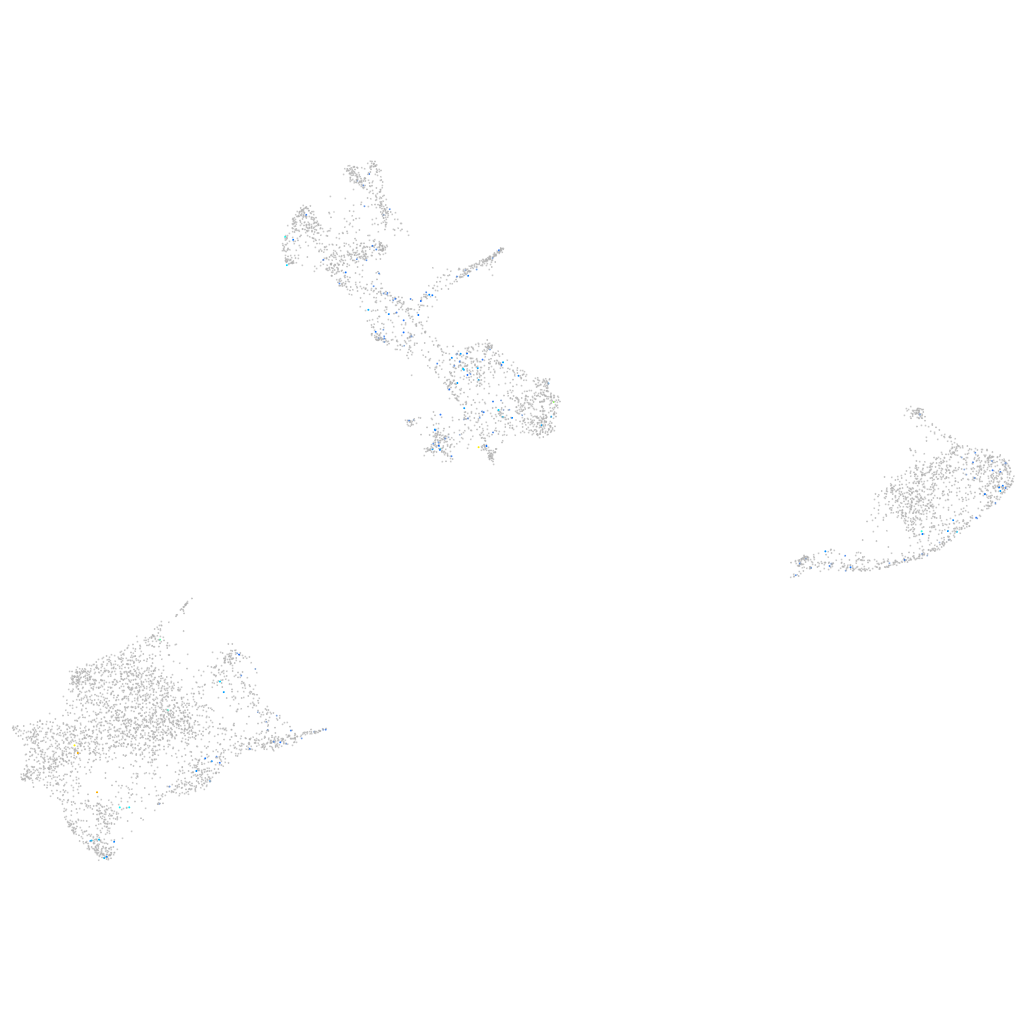
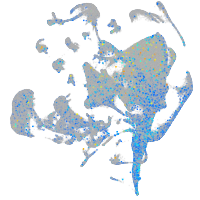
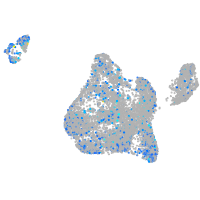
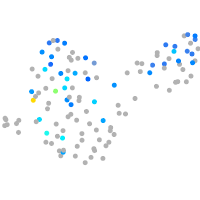
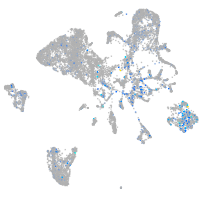
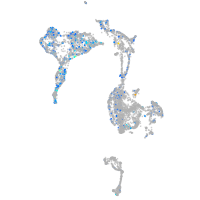
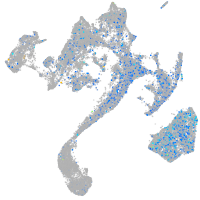
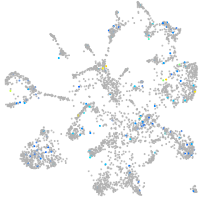
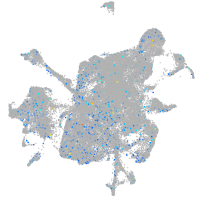
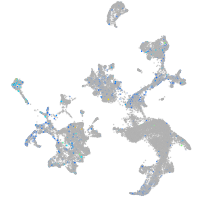
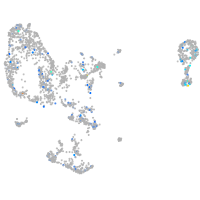
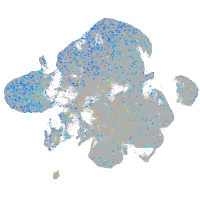
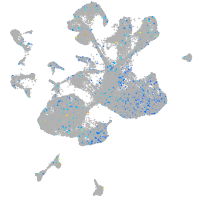
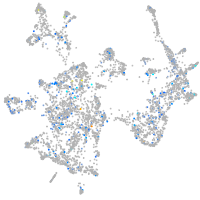
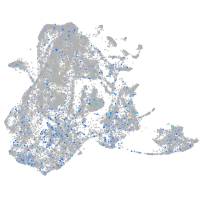
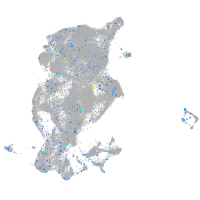
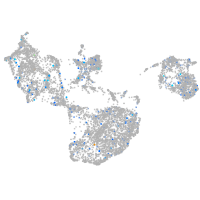
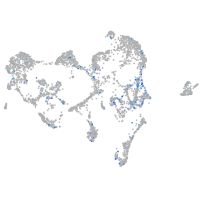
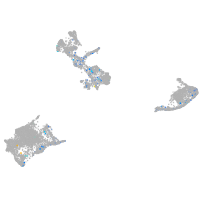
Gene expression UMAP
Display:
Expression
Stage
Other cell groups
all cells
blastomeres
PGCs
endoderm
axial mesoderm
muscle
mural cells /
non-skeletal muscle
mesenchyme
hematopoietic /
vasculature
pronephros
neural
spinal cord / glia
eye
taste / olfactory
otic / lateral line
epidermis
periderm
fin
ionocytes / mucous
pigment cells
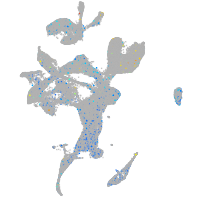
Expression by stage/cluster
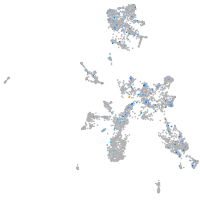
Correlated gene expression
Positive correlation
Negative correlation
Gene
r
Gene
r
mybpc1
0.196
pvalb2
-0.064
tbx18
0.188
gstp1
-0.059
adra1ab
0.166
pvalb1
-0.055
nptx2a
0.162
si:dkey-251i10.2
-0.050
LOC108182890
0.158
uraha
-0.045
st3gal1l2
0.158
gch2
-0.044
si:ch211-152c8.2
0.155
actc1b
-0.044
BX510657.1
0.152
mylpfa
-0.043
CR318588.1
0.145
krt4
-0.042
si:ch211-145o7.3
0.143
akr1b1
-0.041
plpp2a
0.141
slc22a7a
-0.038
wdr93
0.141
pfn1
-0.036
si:ch73-7i4.1
0.135
CABZ01021592.1
-0.036
armc4
0.134
ckma
-0.034
XLOC-027664
0.134
myhz1.1
-0.034
tgfb2l
0.133
aldob
-0.033
FO904898.5
0.132
cyb5a
-0.033
plcd3a
0.130
cyt1
-0.032
abcc9
0.128
tnnt3b
-0.032
si:ch73-261i21.2
0.126
hbae3
-0.031
CABZ01046949.1
0.125
tnni2a.4
-0.031
CU137680.2
0.125
sult1st1
-0.031
CU984600.2
0.124
tcnbb
-0.030
gpc5c
0.121
pts
-0.030
LOC100536860
0.120
txn
-0.030
si:ch211-145h19.5
0.120
anxa5b
-0.030
FP016005.2
0.117
cotl1
-0.030
BX950225.1
0.116
bco1
-0.030
LOC101886920
0.114
zgc:110339
-0.029
rasl12
0.113
zgc:153031
-0.028
CR392026.2
0.113
nme2b.2
-0.028
LOC108180795
0.112
tmem130
-0.028
AL772314.1
0.112
mylpfb
-0.028
cyldl
0.111
actb2
-0.026
LOC100004160
0.109
tnnc2
-0.026