Daniocell
hmha1a (ionocytes / mucous-producing)
histocompatibility (minor) HA-1 a [Source:ZFIN;Acc:ZDB-GENE-140106-47]
ZFIN
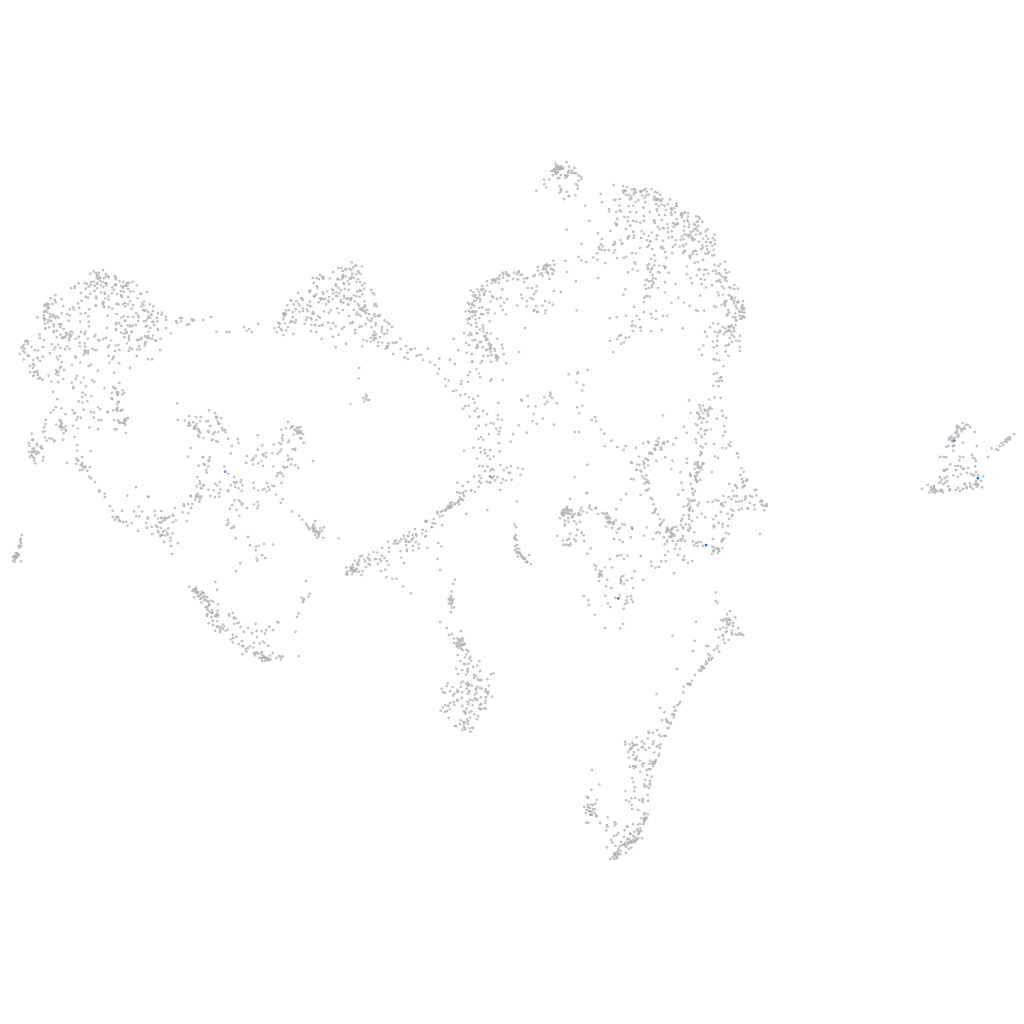
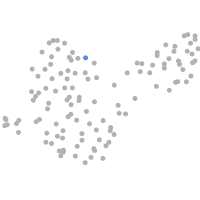
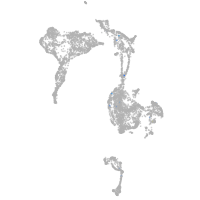
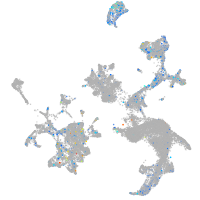
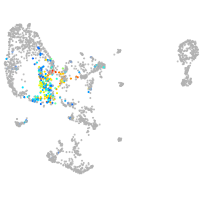
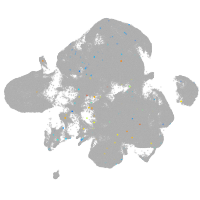
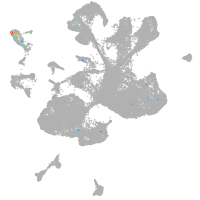
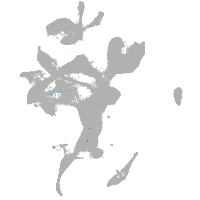
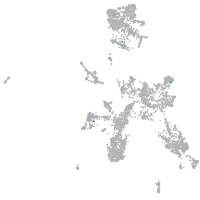
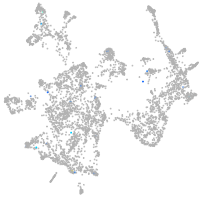
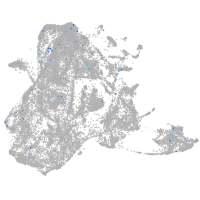
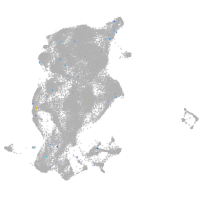
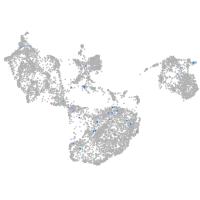
Gene expression UMAP
Display:
Expression
Stage
Other cell groups
all cells
blastomeres
PGCs
endoderm
axial mesoderm
muscle
mural cells /
non-skeletal muscle
mesenchyme
hematopoietic /
vasculature
pronephros
neural
spinal cord / glia
eye
taste / olfactory
otic / lateral line
epidermis
periderm
fin
ionocytes / mucous
pigment cells
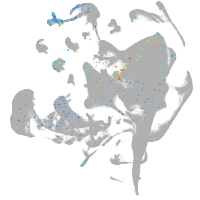
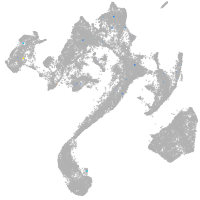
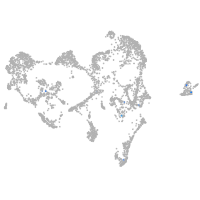
Expression by stage/cluster
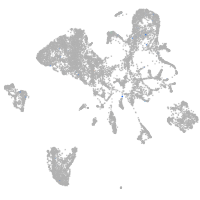
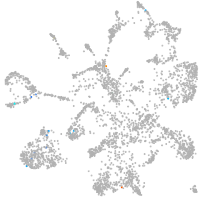
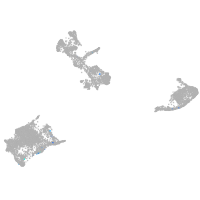
Correlated gene expression
Positive correlation
Negative correlation
Gene
r
Gene
r
LOC101885690
0.510
si:ch211-195b11.3
-0.050
p2ry13
0.510
cldnh
-0.042
itga2b
0.510
cldne
-0.039
XLOC-016965
0.503
icn
-0.039
mir223
0.490
soul2
-0.038
AL954142.1
0.490
krt4
-0.037
fgl2a
0.453
spint2
-0.037
susd1
0.441
bloc1s6
-0.036
LOC100536469
0.436
tmbim4
-0.035
BX510919.1
0.412
si:dkey-247k7.2
-0.034
cd44b
0.412
zgc:110333
-0.034
gp1bb
0.411
si:ch211-202f5.3
-0.034
CR847543.1
0.401
chmp2bb
-0.034
XLOC-024151
0.389
si:ch1073-443f11.2
-0.034
grinaa
0.385
znf185
-0.033
si:dkey-260g12.1
0.379
si:ch211-79k12.1
-0.033
BX005443.1
0.377
tmem189
-0.033
XLOC-007246
0.377
fuca1.1
-0.032
XLOC-002522
0.376
cyt1
-0.032
plek
0.361
atp1a1a.2
-0.032
diras2
0.358
tspo
-0.032
si:dkey-85k15.4
0.356
si:dkey-248g15.3
-0.032
plac8l1
0.350
s100v2
-0.031
tubb1
0.345
tcima
-0.031
rassf2b
0.339
zgc:193505
-0.031
prkacba
0.323
dsg2.1
-0.031
fermt3b
0.323
selenow1
-0.030
rltgr
0.311
cst14b.1
-0.030
LOC110439838
0.310
kif5ba
-0.030
btk
0.306
bik
-0.030
DIPK2B
0.302
cox6c
-0.030
XLOC-042707
0.297
fa2h
-0.029
CABZ01066694.1
0.277
sec23b
-0.029
FQ311924.1
0.275
CABZ01079427.1
-0.029
FP015808.1
0.268
mgll
-0.029