Daniocell
hint3 (hematopoietic / vasculature)
histidine triad nucleotide binding protein 3
ZFIN
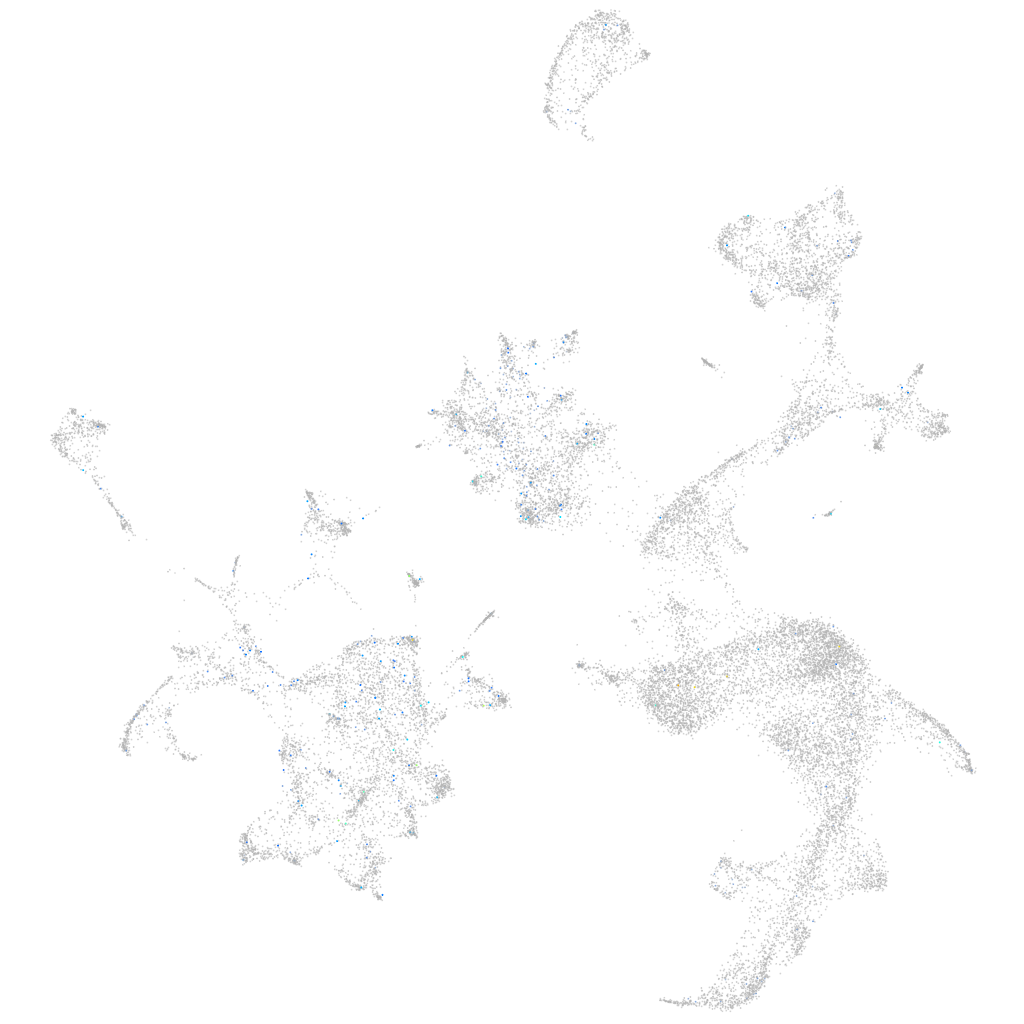
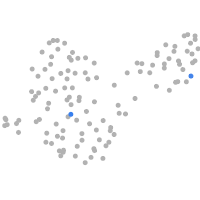
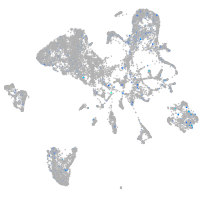
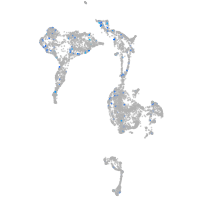
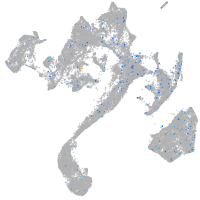
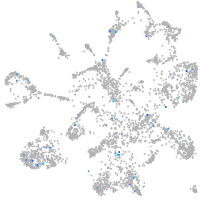
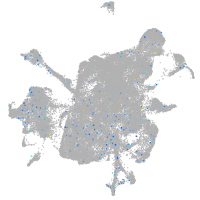
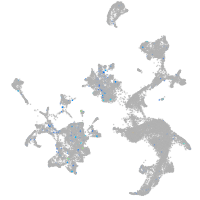
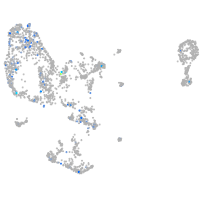
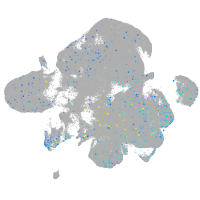
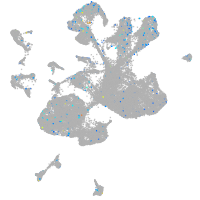
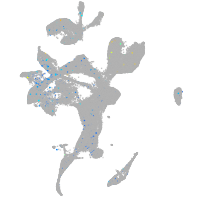
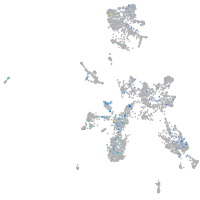
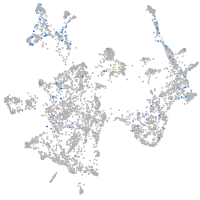
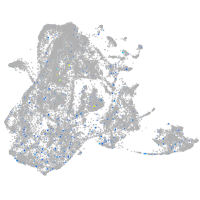
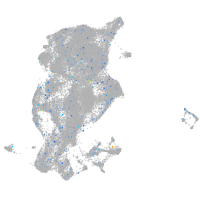
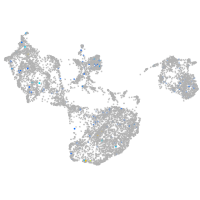
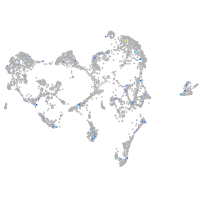
Gene expression UMAP
Display:
Expression
Stage
Other cell groups
all cells
blastomeres
PGCs
endoderm
axial mesoderm
muscle
mural cells /
non-skeletal muscle
mesenchyme
hematopoietic /
vasculature
pronephros
neural
spinal cord / glia
eye
taste / olfactory
otic / lateral line
epidermis
periderm
fin
ionocytes / mucous
pigment cells
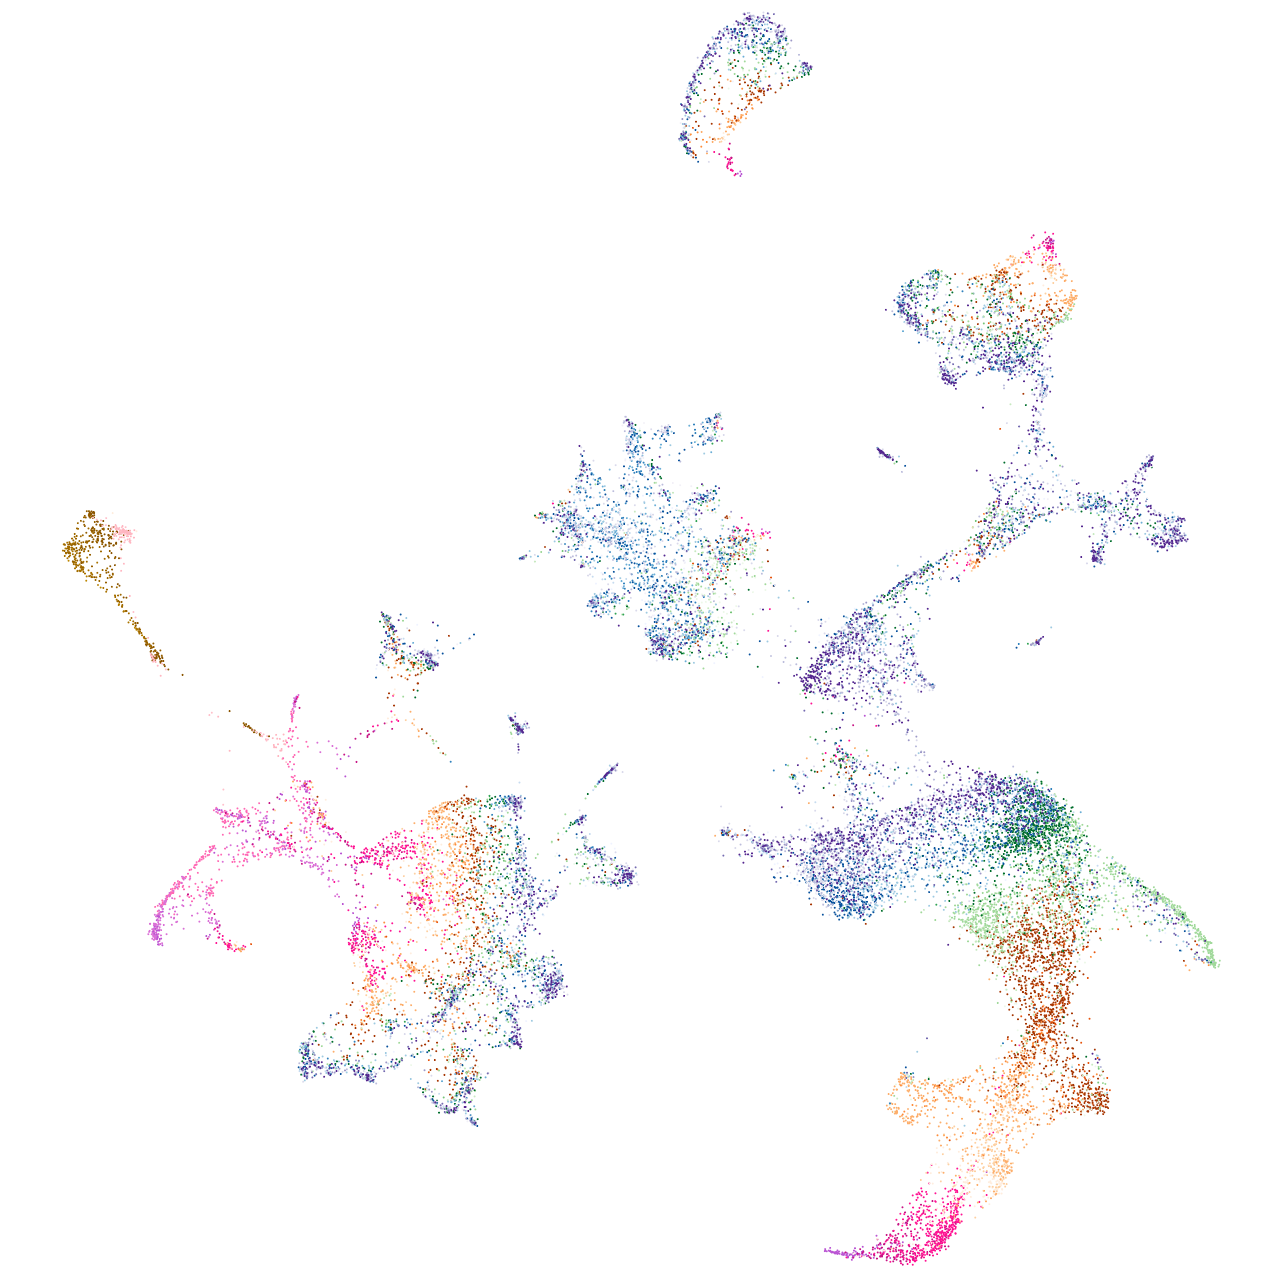
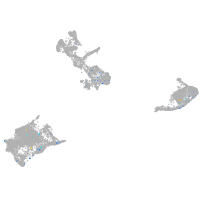
Expression by stage/cluster
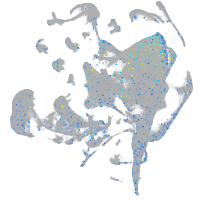
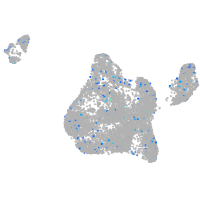
Correlated gene expression
Positive correlation
Negative correlation
Gene
r
Gene
r
myo1ha
0.150
hemgn
-0.045
LOC110438422
0.124
hbae1.3
-0.041
LOC103909053
0.119
blvrb
-0.039
RF00428
0.101
hbae1.1
-0.038
pcdh2g13
0.098
hbbe2
-0.037
CR774194.1
0.098
slc4a1a
-0.037
CR788254.3
0.096
hbae3
-0.037
gprc6a
0.095
hbbe1.3
-0.036
ANPEP
0.094
hbbe1.1
-0.036
CABZ01012885.1
0.094
cahz
-0.036
XLOC-019741
0.091
prdx2
-0.036
LO017802.1
0.089
tspo
-0.035
AL929276.2
0.086
tmem14ca
-0.034
BX927335.2
0.084
hbbe1.2
-0.033
XLOC-043229
0.082
zgc:163057
-0.032
CU682811.2
0.081
hbbe3
-0.032
gcgra
0.080
hbae5
-0.032
CU468917.1
0.078
nt5c2l1
-0.030
CU179758.1
0.077
urod
-0.030
XLOC-032636
0.077
alas2
-0.030
LOC101886052
0.076
klf1
-0.030
si:ch73-7i4.1
0.076
plac8l1
-0.030
si:dkey-192j17.1
0.074
si:ch211-227m13.1
-0.029
BX936433.2
0.072
nmt1b
-0.028
LOC103911612
0.072
hmbsb
-0.028
pfn2l
0.071
znfl2a
-0.027
cbln11
0.070
hdr
-0.027
marcksl1a
0.068
fth1a
-0.026
fxyd6l
0.067
rfesd
-0.026
gnb1b
0.067
rhd
-0.025
rab25a
0.066
uros
-0.025
ywhah
0.066
si:ch211-207c6.2
-0.025
XLOC-023402
0.066
tmod4
-0.025
fkbp1aa
0.065
si:dkey-93h22.7
-0.024
nova2
0.065
zgc:163080
-0.024