Daniocell
gspt1 (pigment cells)
G1 to S phase transition 1
ZFIN
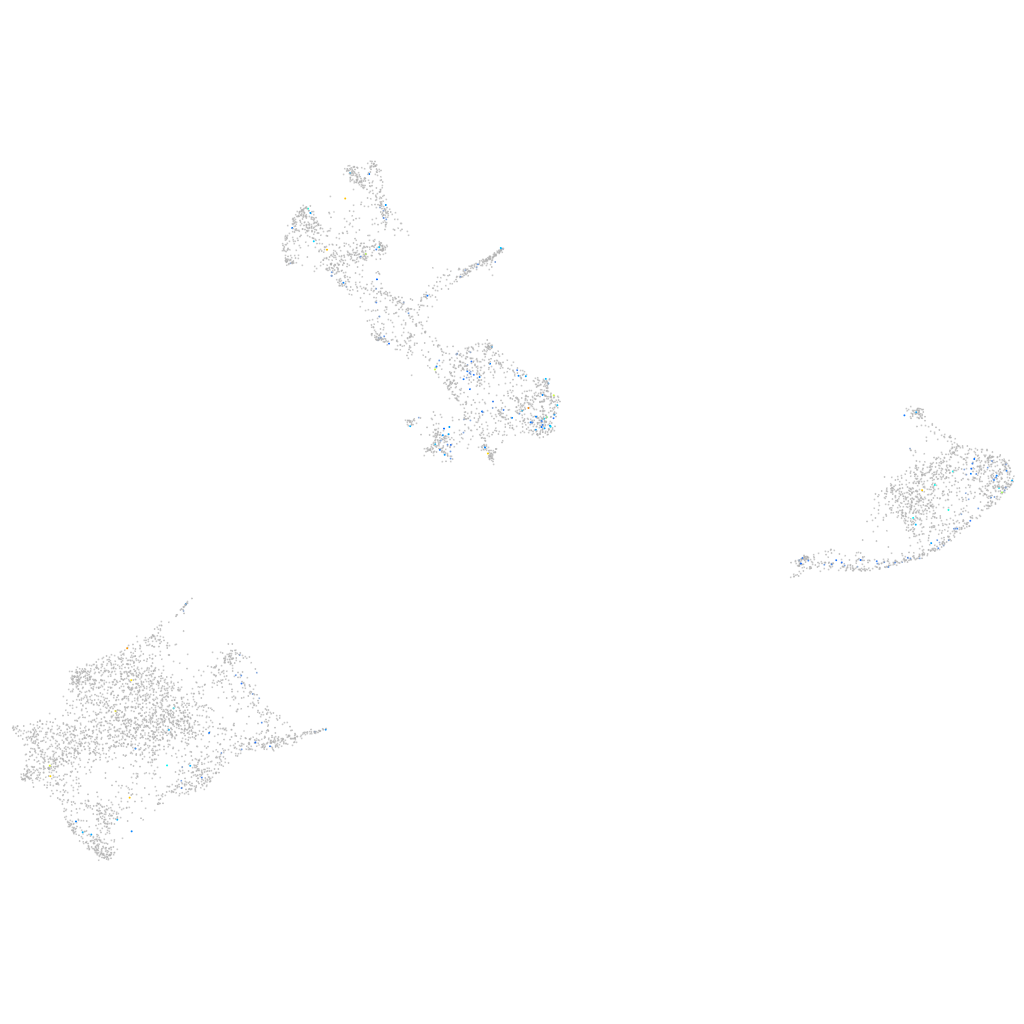
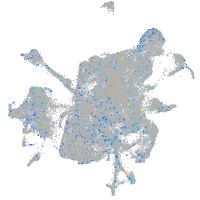
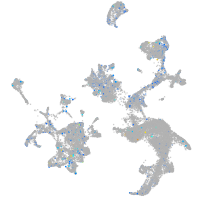
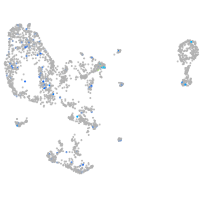
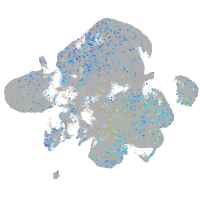
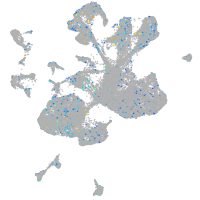
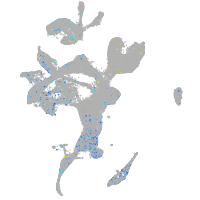
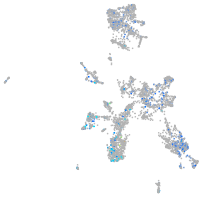
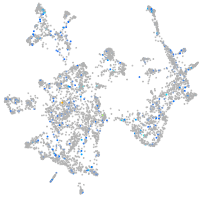
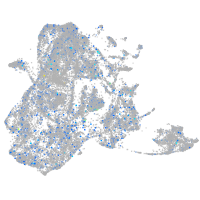
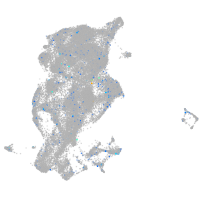
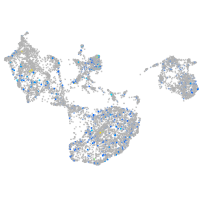
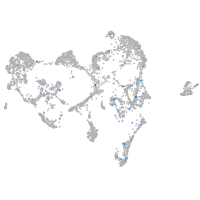
Gene expression UMAP
Display:
Expression
Stage
Other cell groups
all cells
blastomeres
PGCs
endoderm
axial mesoderm
muscle
mural cells /
non-skeletal muscle
mesenchyme
hematopoietic /
vasculature
pronephros
neural
spinal cord / glia
eye
taste / olfactory
otic / lateral line
epidermis
periderm
fin
ionocytes / mucous
pigment cells
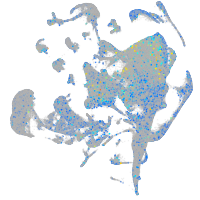
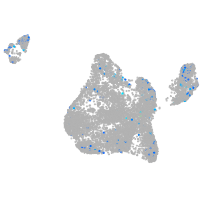
Expression by stage/cluster
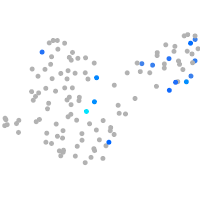
Correlated gene expression
Positive correlation
Negative correlation
Gene
r
Gene
r
tacr1a
0.197
CABZ01021592.1
-0.055
XLOC-020187
0.187
si:dkey-151g10.6
-0.052
si:dkey-120c6.5
0.170
paics
-0.050
cacng5b
0.164
tmem130
-0.049
LOC101885764
0.157
si:dkey-251i10.2
-0.048
scpp8
0.156
slc22a7a
-0.046
si:ch211-152f22.4
0.152
uraha
-0.046
si:ch211-51f19.1
0.150
gch2
-0.046
BX470238.1
0.144
aox5
-0.045
slc8b1
0.141
bco1
-0.043
CABZ01005857.2
0.139
mdh1aa
-0.042
CABZ01040021.1
0.139
si:ch211-251b21.1
-0.042
XLOC-029274
0.136
pts
-0.041
si:dkey-261m9.12
0.136
cax1
-0.037
LO018564.1
0.132
atic
-0.037
LOC103909988
0.132
gpd1b
-0.036
si:dkey-11f4.7
0.132
akr1b1
-0.036
XLOC-012772
0.130
rpl18a
-0.035
CT027702.1
0.130
mylpfa
-0.035
LOC100005187
0.126
zgc:110339
-0.034
tnnt2b
0.125
gstp1
-0.034
abcc13
0.124
TMEM19
-0.034
CU855688.2
0.119
krt18b
-0.034
sh3pxd2ab
0.119
sprb
-0.034
zgc:194679
0.113
pvalb1
-0.033
LOC108181449
0.111
hbae3
-0.032
LOC103909738
0.108
cyb5a
-0.032
FP016142.1
0.108
rbp4l
-0.032
ifngr1
0.106
oacyl
-0.031
XLOC-002305
0.105
pon3.2
-0.030
XLOC-026920
0.104
cx30.3
-0.030
si:dkey-11d20.1
0.103
cyt1
-0.030
kdf1b
0.103
actc1b
-0.029
bbs4
0.102
slc2a11b
-0.028
LOC101884680
0.102
slc2a15a
-0.028