Daniocell
grifin (hematopoietic / vasculature)
galectin-related inter-fiber protein
ZFIN
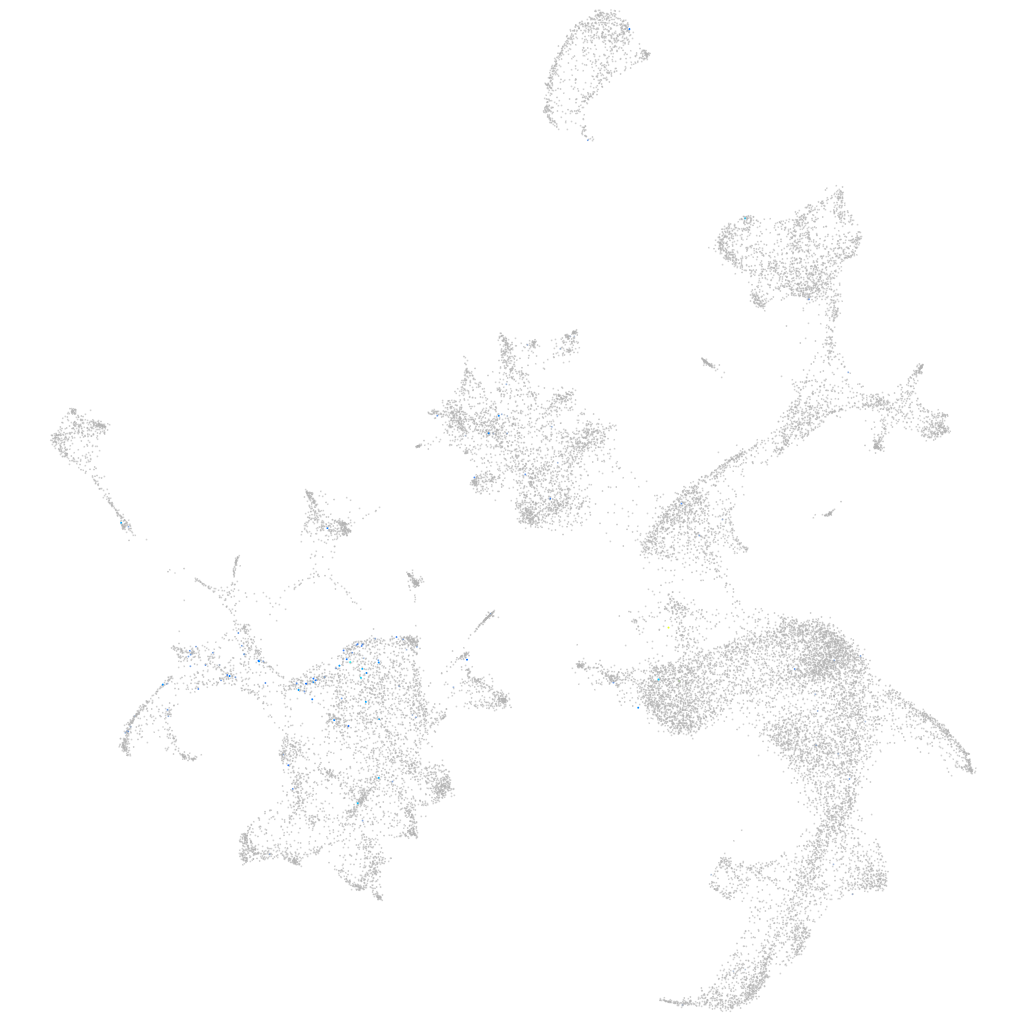
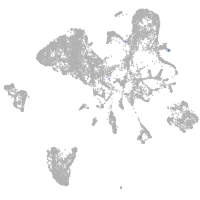
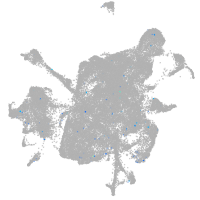
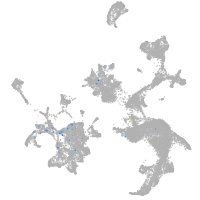
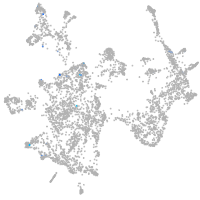
Gene expression UMAP
Display:
Expression
Stage
Other cell groups
all cells
blastomeres
PGCs
endoderm
axial mesoderm
muscle
mural cells /
non-skeletal muscle
mesenchyme
hematopoietic /
vasculature
pronephros
neural
spinal cord / glia
eye
taste / olfactory
otic / lateral line
epidermis
periderm
fin
ionocytes / mucous
pigment cells
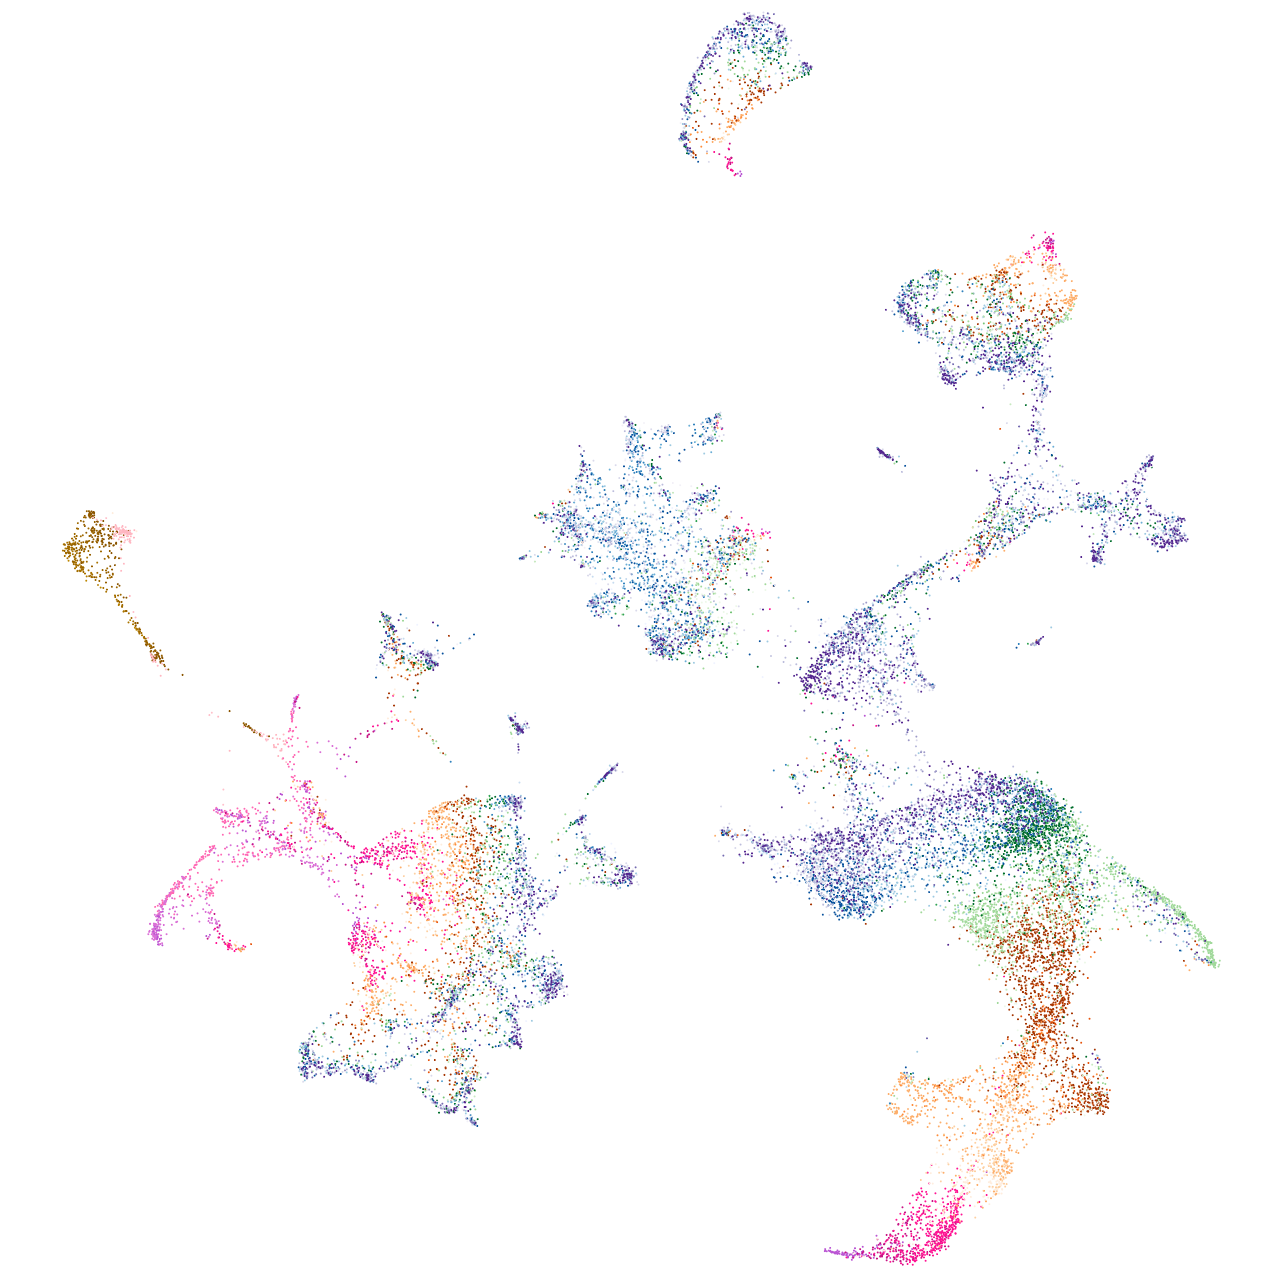
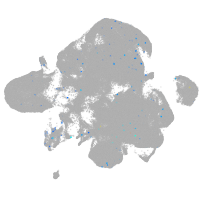
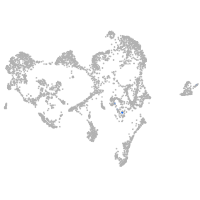
Expression by stage/cluster
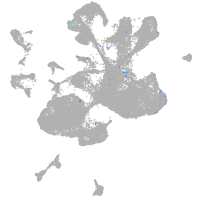
Correlated gene expression
Positive correlation
Negative correlation
Gene
r
Gene
r
BX664614.1
0.186
hbae1.1
-0.041
LOC110439422
0.171
hbbe1.3
-0.038
si:dkeyp-34c12.4
0.126
hbbe2
-0.038
LOC110437963
0.121
hbae3
-0.038
LOC110440024
0.116
blvrb
-0.038
BX248089.1
0.116
hbae1.3
-0.037
XLOC-026741
0.109
hbbe1.2
-0.037
BX664750.1
0.108
prdx2
-0.035
xcr1a.1
0.105
hbbe1.1
-0.035
FITM1 (1 of many)
0.100
nt5c2l1
-0.034
hapln4
0.099
alas2
-0.034
abhd8b
0.099
hemgn
-0.032
si:dkey-54j5.2
0.095
cahz
-0.032
XLOC-007147
0.092
slc4a1a
-0.030
BX649384.3
0.091
nmt1b
-0.027
LOC101882407
0.090
zgc:56095
-0.026
il13ra2
0.089
tmod4
-0.026
LOC100538233
0.089
tmem14ca
-0.026
synpo2lb
0.088
tspo
-0.026
BX276103.1
0.086
uros
-0.026
gmpr2
0.085
plac8l1
-0.026
sntg2
0.085
si:ch211-250g4.3
-0.025
chrm2b
0.085
gpx1a
-0.025
XLOC-043355
0.085
mcl1a
-0.024
XLOC-009608
0.085
epb41b
-0.024
frmpd3
0.084
fth1a
-0.024
si:ch211-122l14.7
0.081
creg1
-0.023
sntg1
0.080
zgc:163057
-0.023
zgc:158258
0.079
mbnl1
-0.023
pimr49
0.079
rfesd
-0.023
stab2
0.078
hbae5
-0.023
hhex
0.076
si:ch211-207c6.2
-0.022
prcp
0.076
CR293511.1
-0.022
casp6l2
0.075
rhag
-0.021
LOC100534765
0.075
klf1
-0.021