Daniocell
gramd4b (pronephros)
GRAM domain containing 4b
ZFIN
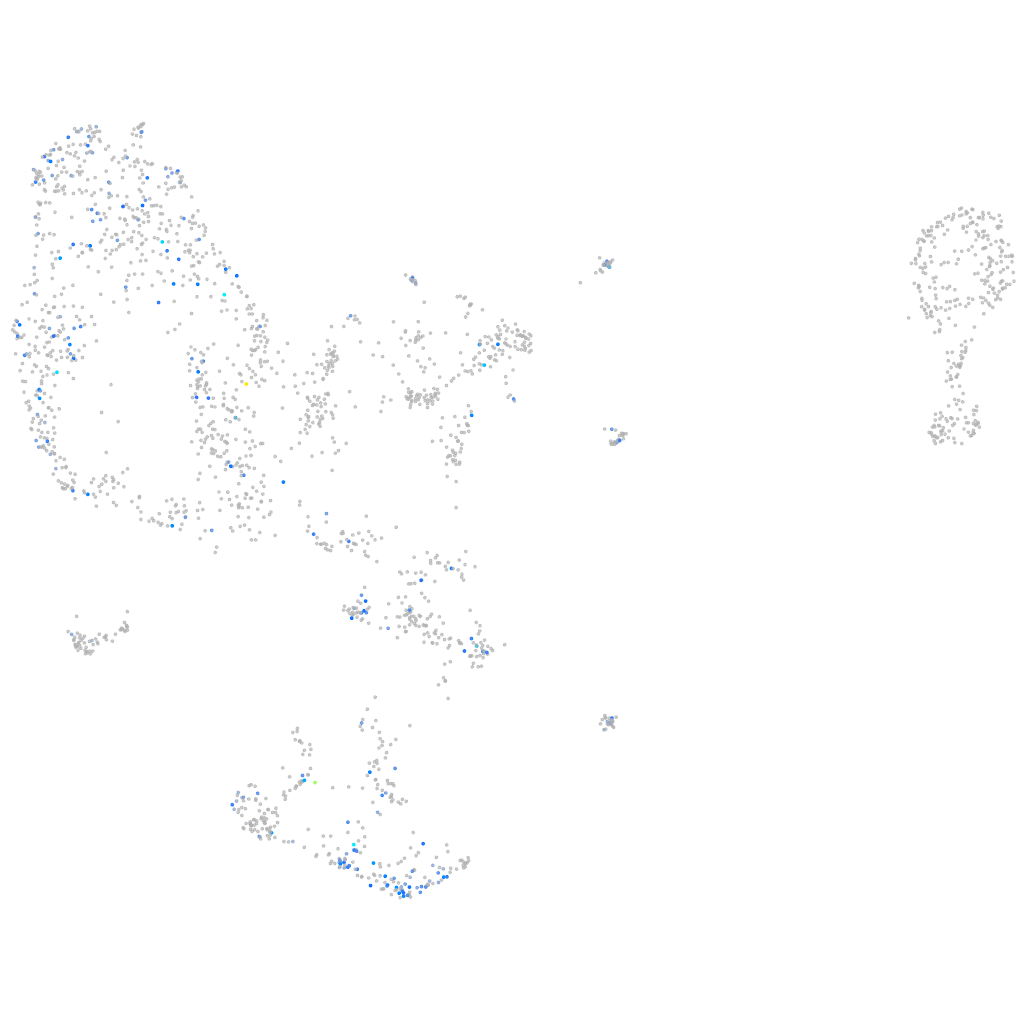
Gene expression UMAP
Display:
Expression
Stage
Other cell groups
all cells
blastomeres
PGCs
endoderm
axial mesoderm
muscle
mural cells /
non-skeletal muscle
mesenchyme
hematopoietic /
vasculature
pronephros
neural
spinal cord / glia
eye
taste / olfactory
otic / lateral line
epidermis
periderm
fin
ionocytes / mucous
pigment cells
Expression by stage/cluster
Correlated gene expression
Positive correlation
Negative correlation
Gene
r
Gene
r
gbe1a
0.248
hspb1
-0.108
CR848784.3
0.248
marcksl1b
-0.105
LOC110437984
0.241
npm1a
-0.103
si:dkey-199m13.5
0.219
hnrnpabb
-0.103
LOC101882334
0.203
si:ch73-281n10.2
-0.101
si:ch1073-416j23.1
0.188
wu:fb97g03
-0.100
rhcgb
0.188
si:ch73-1a9.3
-0.098
si:dkey-195m11.11
0.187
marcksb
-0.098
NC-002333.11
0.174
apoc1
-0.097
si:dkey-23a13.1.1
0.173
dkc1
-0.094
mt-nd4
0.172
apoeb
-0.094
aspg
0.170
fbl
-0.094
sptssb
0.169
akap12b
-0.093
cdh17
0.169
hnrnpaba
-0.093
LOC103910253
0.168
cdx4
-0.092
chac1
0.165
seta
-0.091
penkb
0.165
snu13b
-0.090
ehd4
0.163
nucks1a
-0.090
mt-nd2
0.162
si:ch73-308l14.2
-0.088
mt-nd1
0.162
srsf2a
-0.088
grhl3
0.160
zmp:0000000624
-0.087
chp1
0.158
snrnp70
-0.087
trim35-12
0.157
zgc:110425
-0.086
mt-atp6
0.155
mphosph10
-0.086
best1
0.153
cx43.4
-0.086
eef1da
0.153
ncl
-0.085
slc7a8a
0.152
cxcl12a
-0.084
glud1a
0.152
hmga1a
-0.084
ap1s3a
0.149
nop56
-0.083
ovol1b
0.148
pfdn4
-0.083
si:dkey-36i7.3
0.147
nop58
-0.083
mt-co1
0.147
rbb4l
-0.083
BX936406.2
0.147
asph
-0.082
atp1b1a
0.147
hmgn2
-0.081
CABZ01079267.1
0.146
sumo3b
-0.081