Daniocell
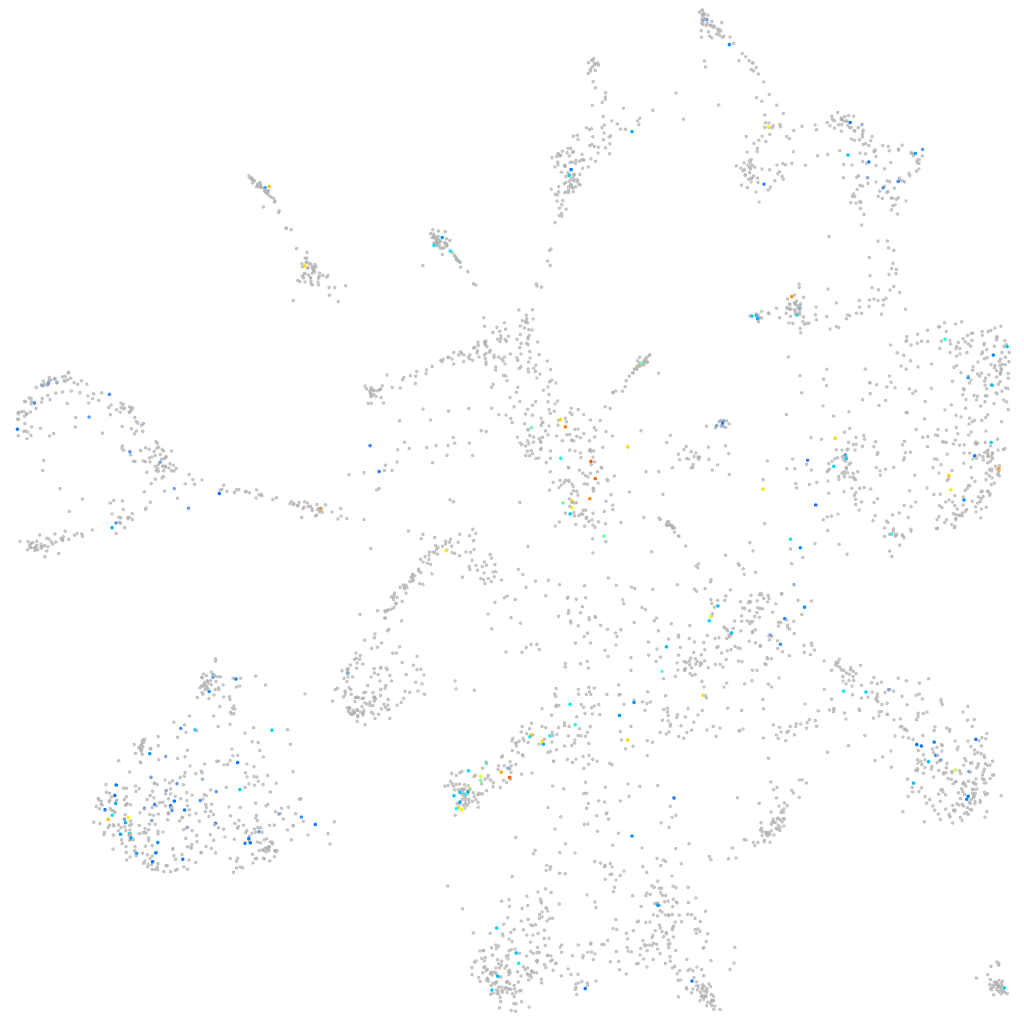
gramd4b (mural cells / non-skeletal muscle)
GRAM domain containing 4b
ZFIN
Gene expression UMAP
Display:
Expression
Stage
Other cell groups
all cells
blastomeres
PGCs
endoderm
axial mesoderm
muscle
mural cells /
non-skeletal muscle
mesenchyme
hematopoietic /
vasculature
pronephros
neural
spinal cord / glia
eye
taste / olfactory
otic / lateral line
epidermis
periderm
fin
ionocytes / mucous
pigment cells
Expression by stage/cluster
Correlated gene expression
Positive correlation
Negative correlation
Gene
r
Gene
r
cilp2
0.187
rps2
-0.105
LOC103910498
0.165
rps12
-0.099
LOC110438754
0.146
rpl13a
-0.098
yjefn3
0.146
rpl38
-0.096
XLOC-009632
0.144
rps24
-0.092
nmur3
0.144
rpl26
-0.085
FP101883.1
0.141
rps20
-0.082
BX248318.1
0.137
rpl23
-0.080
LOC110439875
0.135
rpl13
-0.080
si:ch211-156l18.4
0.134
tpt1
-0.079
gpr20
0.133
rps15
-0.078
si:dkey-18a10.3
0.132
rpl39
-0.078
rnf17
0.127
rps3
-0.076
si:ch1073-450f2.1
0.126
rpl10a
-0.075
pparab
0.125
zgc:153867
-0.074
LOC101886884
0.122
rps7
-0.074
or123-1
0.121
rpl8
-0.074
kcne4
0.121
flna
-0.074
LOC110438312
0.120
rpl31
-0.073
CT025771.1
0.119
si:dkey-151g10.6
-0.073
LOC110439892
0.119
rpl14
-0.072
cnksr2a
0.118
rpl17
-0.069
si:ch211-153b23.7
0.116
rplp0
-0.069
CSMD3
0.115
rpl36
-0.068
si:ch211-276c2.2
0.114
col4a6
-0.068
RNF14 (1 of many)
0.114
rpl28
-0.067
cfap45
0.113
acta2
-0.067
dusp3b
0.112
rpl7
-0.067
kctd12.2
0.112
rps27a
-0.066
si:dkey-262g12.12
0.111
rps23
-0.065
rem1
0.110
rplp2l
-0.065
ptprnb
0.110
rplp1
-0.064
nfe2l2b
0.109
rps21
-0.064
si:dkey-275b16.2
0.108
myl9a
-0.064
atad3
0.107
rps5
-0.063