Daniocell
gas6 (axial mesoderm)
growth arrest-specific 6
ZFIN
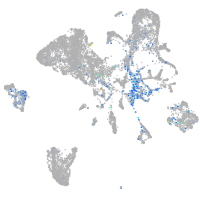
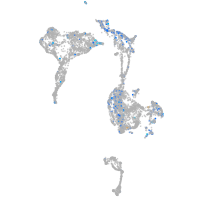
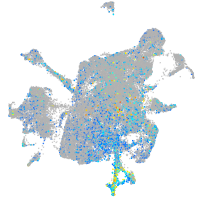
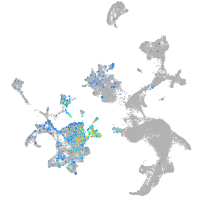
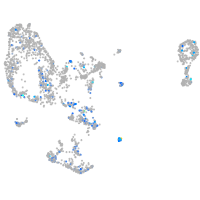
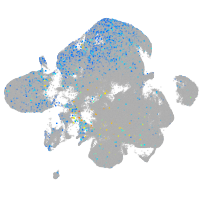
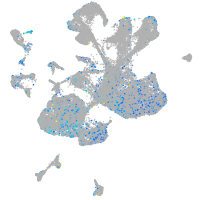
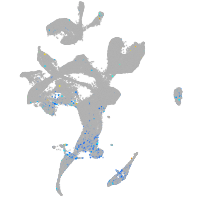
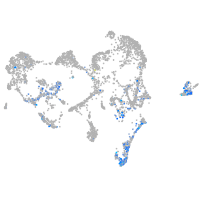
Gene expression UMAP
Display:
Expression
Stage
Other cell groups
all cells
blastomeres
PGCs
endoderm
axial mesoderm
muscle
mural cells /
non-skeletal muscle
mesenchyme
hematopoietic /
vasculature
pronephros
neural
spinal cord / glia
eye
taste / olfactory
otic / lateral line
epidermis
periderm
fin
ionocytes / mucous
pigment cells
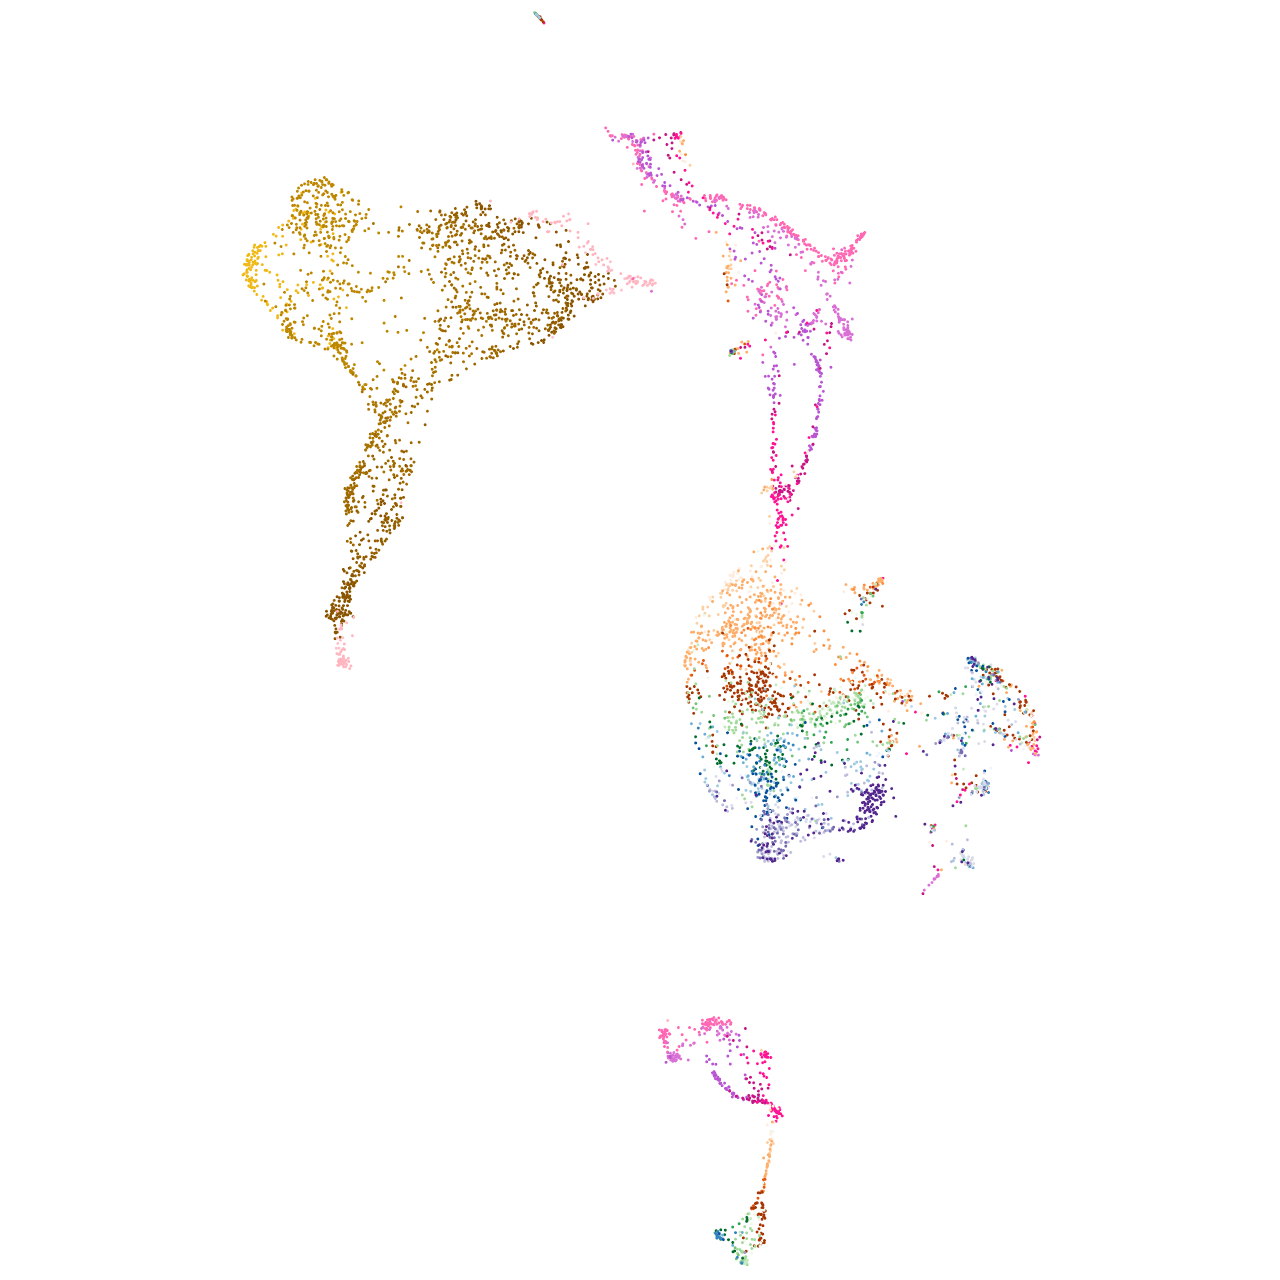
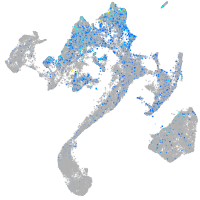
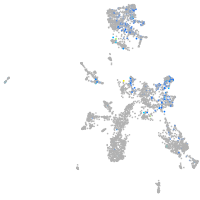
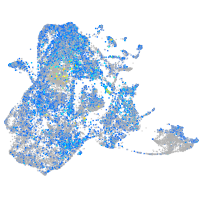
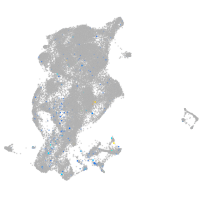
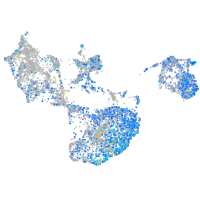
Expression by stage/cluster
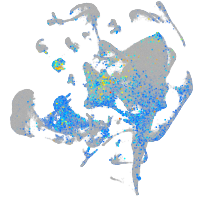
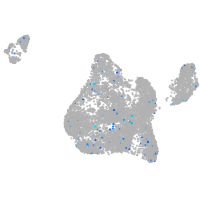
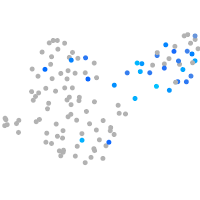
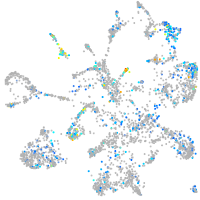
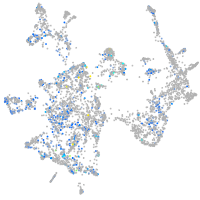
Correlated gene expression
Positive correlation
Negative correlation
Gene
r
Gene
r
si:dkey-106l3.7
0.211
stm
-0.085
hao1
0.175
gnl3
-0.072
s1pr3a
0.157
fbl
-0.069
FO904898.1
0.153
si:ch211-152c2.3
-0.069
bmp7b
0.148
pitx2
-0.069
LOC103912005
0.145
zmp:0000000624
-0.068
tmem119b
0.144
hnrnpa1b
-0.067
LOC100537317
0.140
zgc:174153
-0.067
ptger2a
0.139
hnrnpm
-0.067
mfap2
0.139
klf17
-0.067
adgra2
0.139
tbx16
-0.067
DSG2
0.138
frzb
-0.066
mmrn2b
0.138
si:dkey-239h2.3
-0.066
zgc:198371
0.137
ctslb
-0.066
gfra1a
0.137
bms1
-0.066
sulf2a
0.136
si:dkey-92i17.2
-0.066
asb13a.2
0.136
ndr2
-0.065
si:ch211-270n8.1
0.134
dkc1
-0.065
CU302323.1
0.133
si:dkey-239j18.2
-0.064
brinp3b
0.132
si:dkey-269i1.4
-0.064
myhc4
0.131
kri1
-0.064
pdgfbb
0.131
shisa2a
-0.063
emid1
0.131
chrd
-0.063
hmha1a
0.131
wu:fb97g03
-0.063
b3gnt7l
0.131
snrpa
-0.062
col1a2
0.129
apoc1
-0.062
BX294379.1
0.128
pes
-0.062
AL831745.1
0.127
stard10
-0.062
pmp22b
0.126
fthl31
-0.062
colec12
0.125
elovl6
-0.061
abrab
0.125
si:ch73-160h15.3
-0.061
hoxa3a
0.125
NC-002333.4
-0.061
ccr11.1
0.122
tpx2
-0.061
fstl1a
0.122
prpf40a
-0.061
cp
0.122
si:dkey-239j18.3
-0.060