Daniocell
galnt10 (hematopoietic / vasculature)
UDP-N-acetyl-alpha-D-galactosamine:polypeptide N-acetylgalactosaminyltransferase 10 (GalNAc-T10)
ZFIN
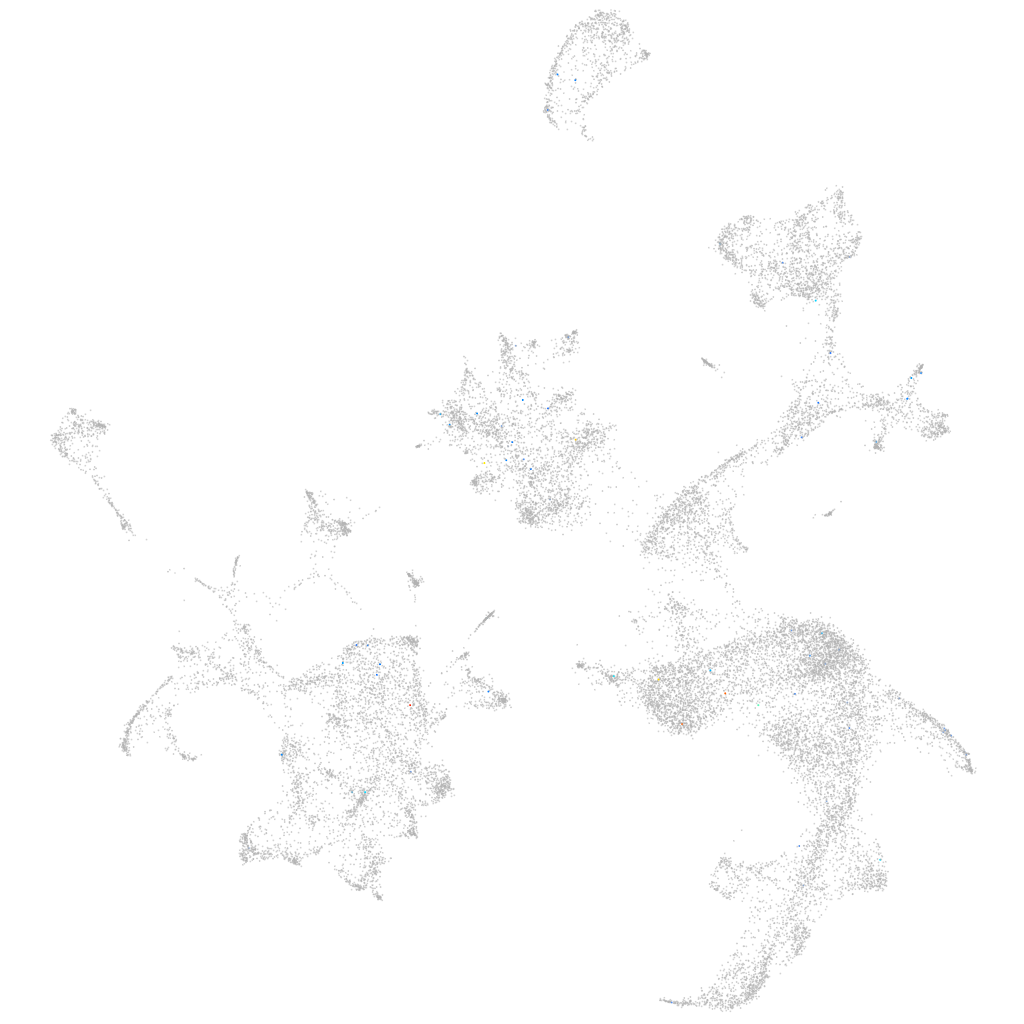
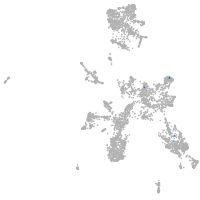
Gene expression UMAP
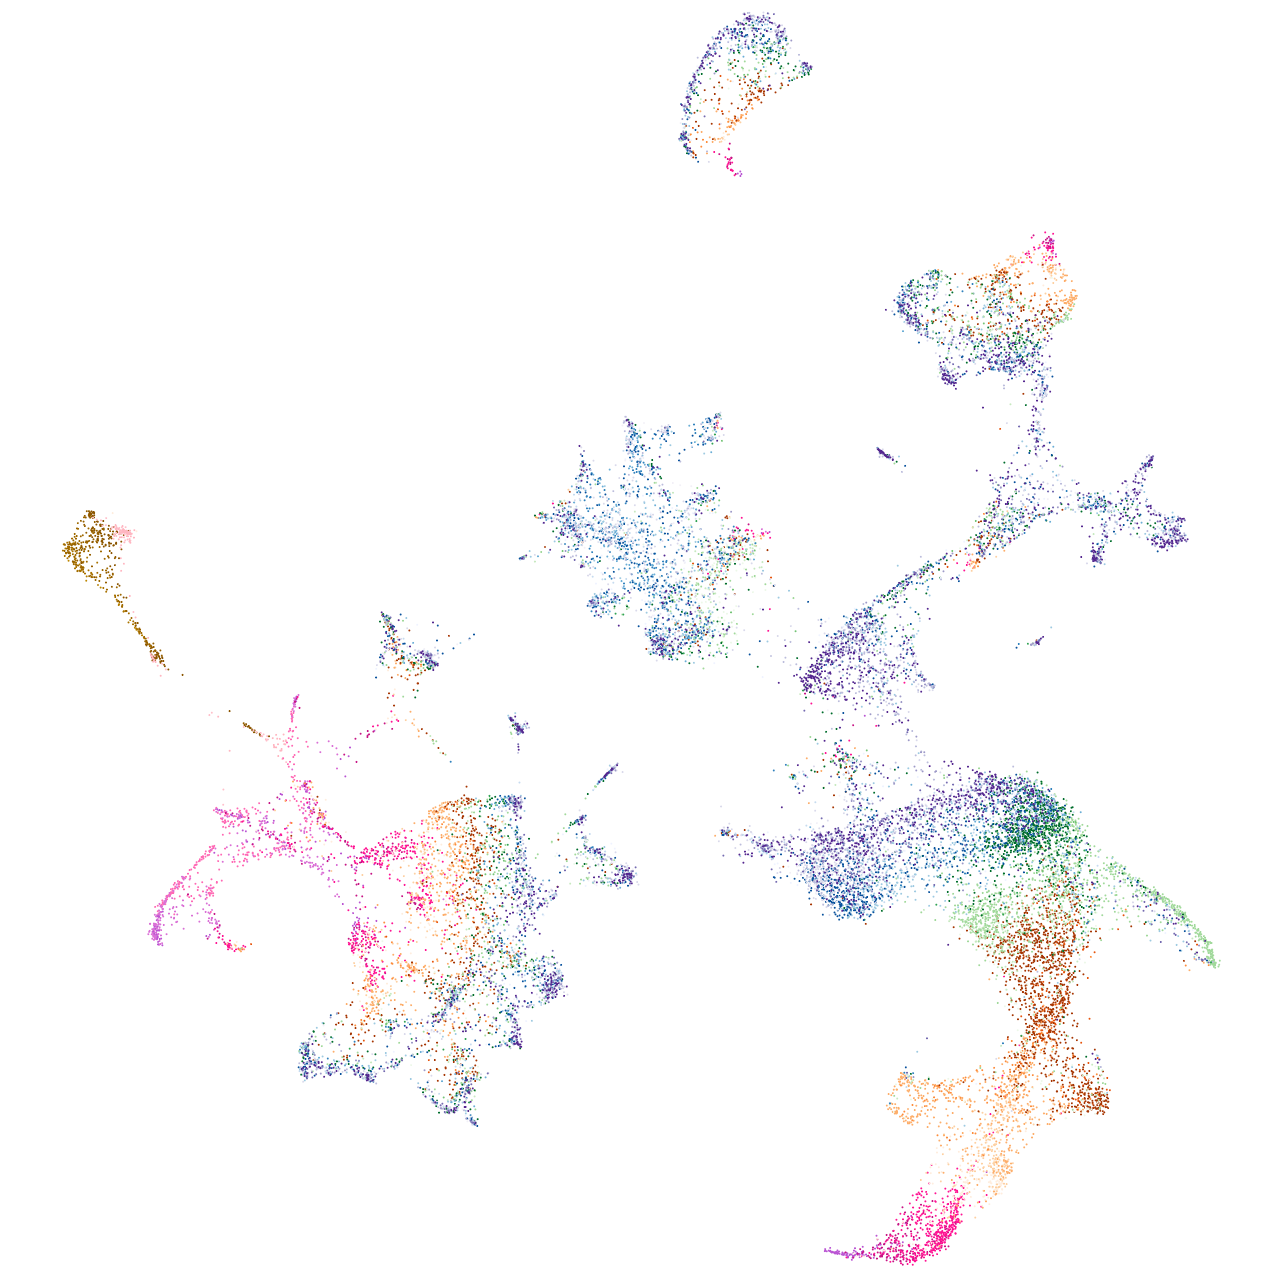
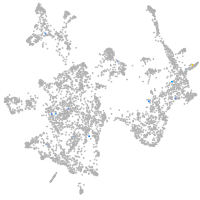
Display:
Expression
Stage
Other cell groups
all cells
blastomeres
PGCs
endoderm
axial mesoderm
muscle
mural cells /
non-skeletal muscle
mesenchyme
hematopoietic /
vasculature
pronephros
neural
spinal cord / glia
eye
taste / olfactory
otic / lateral line
epidermis
periderm
fin
ionocytes / mucous
pigment cells
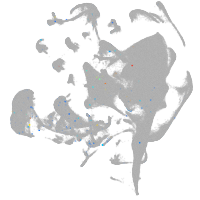
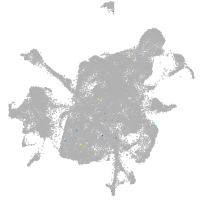
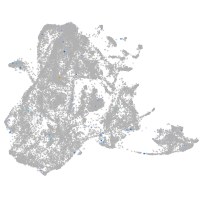
Expression by stage/cluster
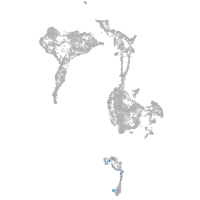
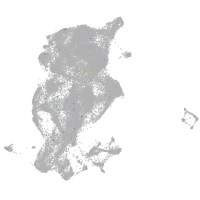
Correlated gene expression
Positive correlation
Negative correlation
Gene
r
Gene
r
ftr16
0.196
zgc:56095
-0.016
LOC110440032
0.194
oaz1b
-0.016
vsig10l2
0.172
ddx39ab
-0.015
BX936303.2
0.171
denr
-0.015
LOC101884463
0.141
urod
-0.015
BX649516.2
0.139
sf3b5
-0.015
xcr1a.1
0.137
dmtn
-0.015
CU571315.3
0.116
cpox
-0.014
CU928131.1
0.115
hmbsa
-0.014
FP102169.1
0.114
hdr
-0.014
pimr186
0.108
nutf2l
-0.014
LOC101882460
0.105
psmc2
-0.014
zgc:158258
0.103
srsf1a
-0.014
LOC100332639
0.100
fbl
-0.013
LOC103909845
0.097
hspa4a
-0.013
si:ch211-284k5.2
0.094
abce1
-0.013
LOC108189470
0.092
zgc:163057
-0.013
CU651669.1
0.092
uros
-0.013
BX957256.1
0.089
anp32b
-0.013
gzma
0.088
taf9
-0.013
CABZ01040055.1
0.087
eif5a2
-0.013
XLOC-040753
0.084
hmbsb
-0.013
mterf2
0.083
tra2a
-0.013
BX005043.1
0.083
alad
-0.013
XLOC-033704
0.082
dlgap5
-0.013
espnla
0.077
ptges3b
-0.013
XLOC-014155
0.072
rps8a
-0.013
LOC103911277
0.071
dpy30
-0.013
LOC100332443
0.071
atp5po
-0.013
LOC110437845
0.070
ucp3
-0.013
iqsec2b
0.070
mt-cyb
-0.013
LOC110440080
0.070
psmc1a
-0.013
XLOC-003357
0.067
prdx3
-0.013
adamts9
0.066
cldng
-0.013
LOC103912056
0.063
cox14
-0.012