
FRAS1 related extracellular matrix 2a
ZFIN 
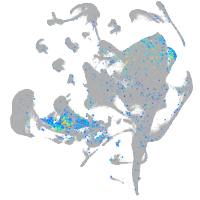
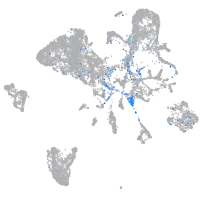
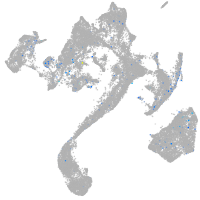
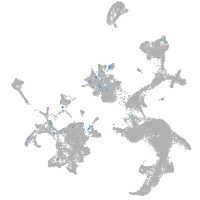
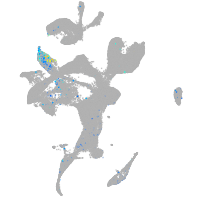
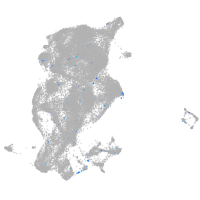
Gene expression UMAP


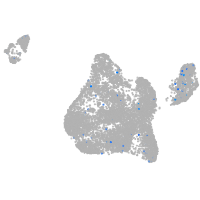
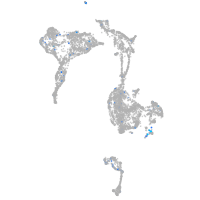
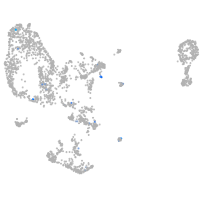
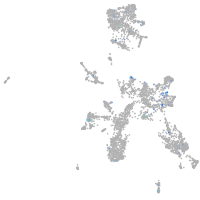
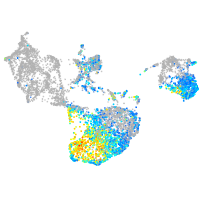
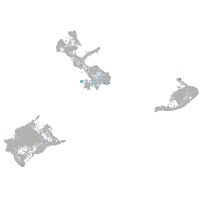
Expression by stage/cluster
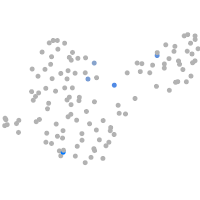
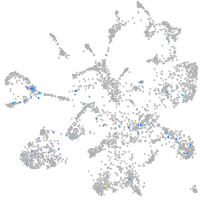
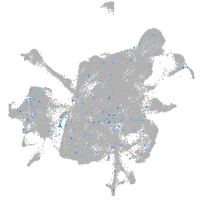
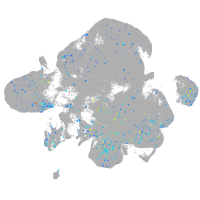
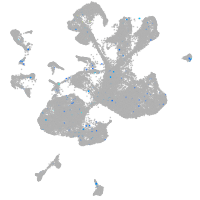
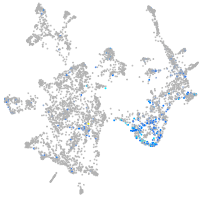
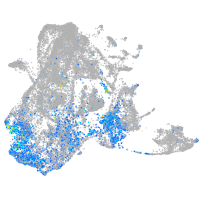
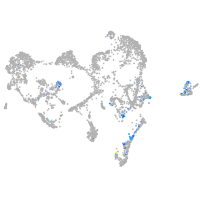
Correlated gene expression