Daniocell
fem1c (ionocytes / mucous-producing)
fem-1 homolog c
ZFIN
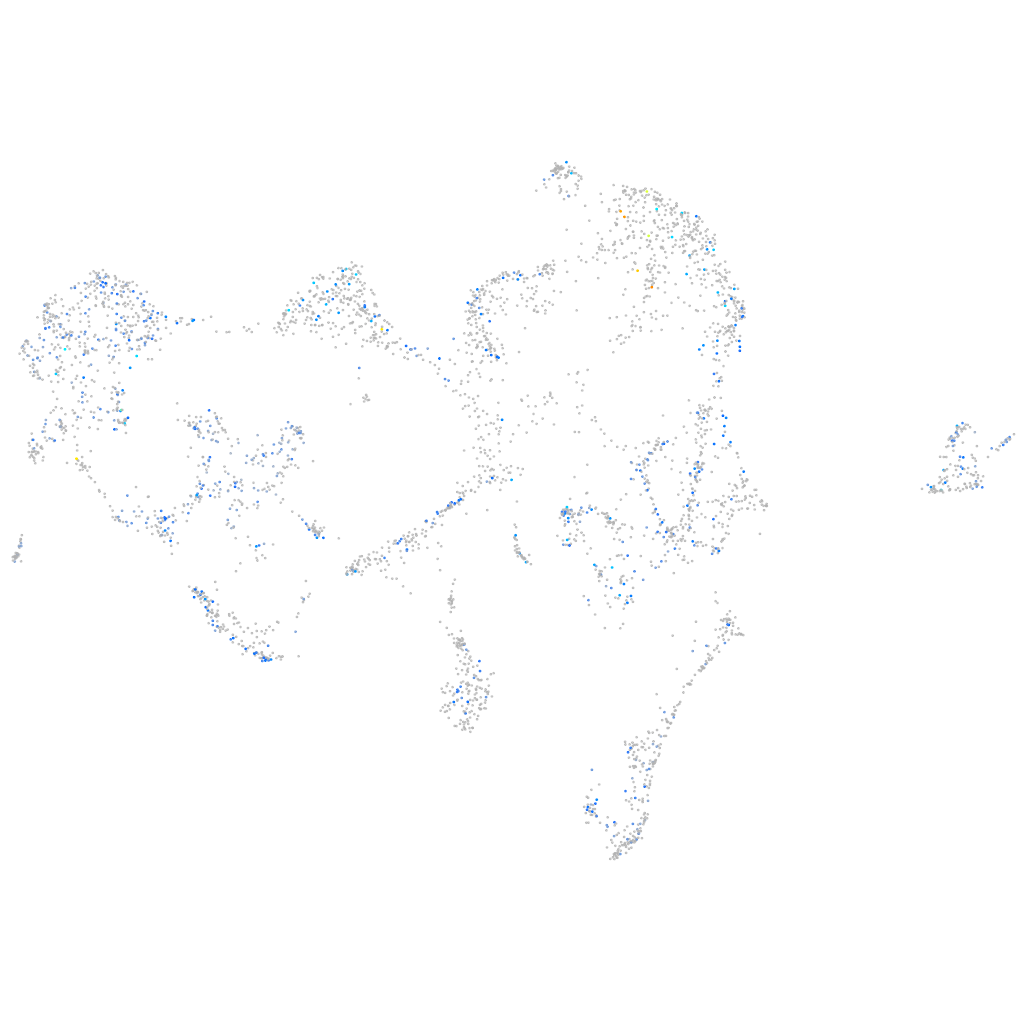
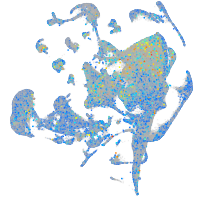
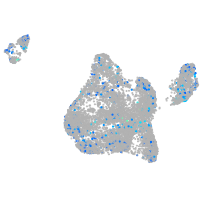
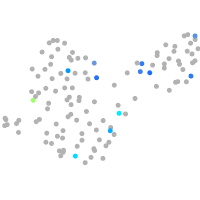
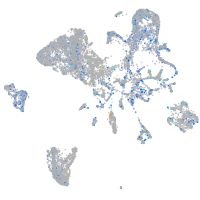
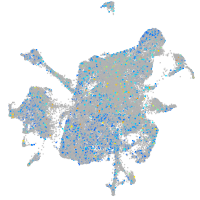
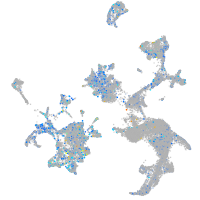
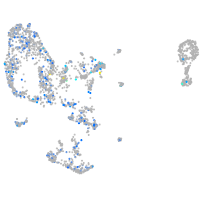
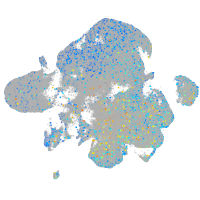
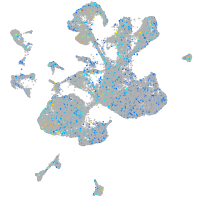
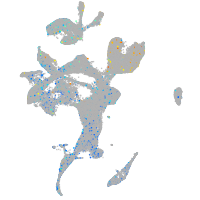
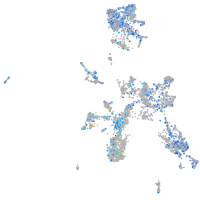
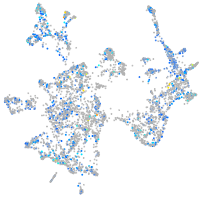
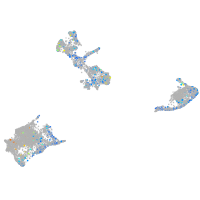
Gene expression UMAP
Display:
Expression
Stage
Other cell groups
all cells
blastomeres
PGCs
endoderm
axial mesoderm
muscle
mural cells /
non-skeletal muscle
mesenchyme
hematopoietic /
vasculature
pronephros
neural
spinal cord / glia
eye
taste / olfactory
otic / lateral line
epidermis
periderm
fin
ionocytes / mucous
pigment cells
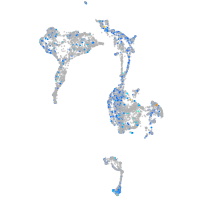
Expression by stage/cluster
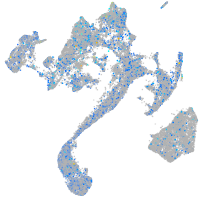
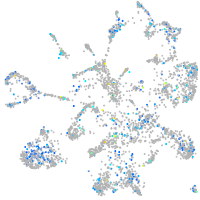
Correlated gene expression
Positive correlation
Negative correlation
Gene
r
Gene
r
lyve1a
0.184
rpl38
-0.059
LOC110438283
0.173
mt-atp8
-0.055
LOC101882178
0.170
si:dkey-44g23.5
-0.053
XLOC-023624
0.155
si:dkey-151g10.6
-0.053
chia.2
0.141
rpl37
-0.050
BX530091.1
0.135
TSTA3 (1 of many)
-0.050
BX005228.1
0.132
arid3a
-0.048
LOC108184022
0.121
agrp
-0.048
pla2r1
0.115
BX469925.3
-0.046
ctsbb
0.113
rps29
-0.046
wdr20b
0.110
tma7
-0.045
vcam1b
0.110
gfi1b
-0.044
fdxr
0.109
rpl39
-0.043
kcnj8
0.107
rpl36a
-0.043
FP003590.1
0.106
tars
-0.043
myhc4
0.106
slc16a12a
-0.043
si:dkeyp-97a10.1
0.104
sat1a.1
-0.043
tmem176l.2
0.104
s100z
-0.042
XLOC-001992
0.104
atp5md
-0.041
cep89
0.102
rps21
-0.040
BX510934.1
0.102
lgals9l3
-0.039
si:dkey-27h10.2
0.101
ost4
-0.039
si:dkeyp-121d4.3
0.100
cox7c
-0.038
ndrg2
0.100
XLOC-042971
-0.038
XLOC-013920
0.099
etv5a
-0.038
LOC110438973
0.098
zgc:174153
-0.038
fam19a5l
0.098
myo6a
-0.037
si:ch73-119p20.1
0.096
zgc:193726
-0.037
LO018605.3
0.096
greb1l
-0.036
usp42
0.094
rpl29
-0.036
homer1b
0.094
pabpc1a
-0.036
arhgap27
0.091
CR855311.1
-0.036
tgfbr1b
0.091
zgc:91849
-0.036
sqstm1
0.091
insl5a
-0.036
CU861651.1
0.091
LOC103911445
-0.036