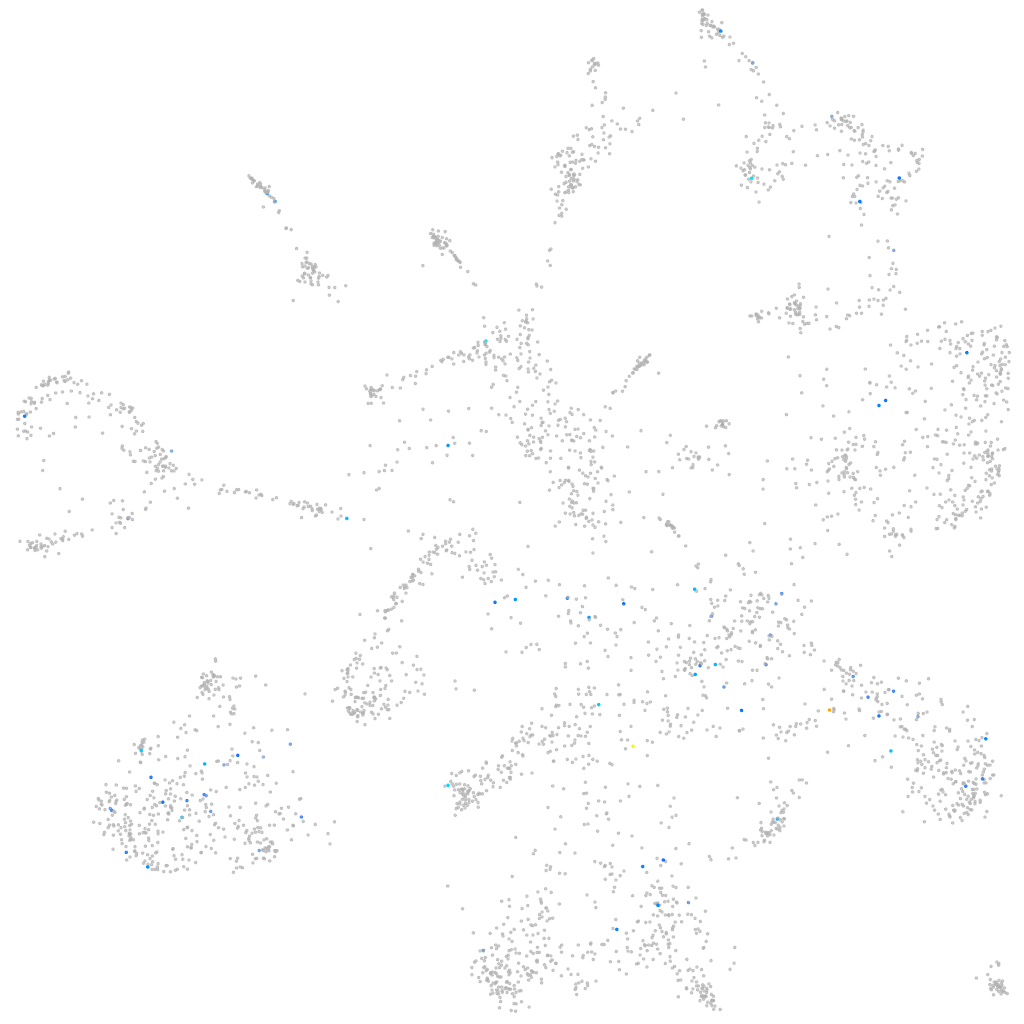
Daniocell
erich2 (mural cells / non-skeletal muscle)
glutamate-rich 2
ZFIN
Gene expression UMAP
Display:
Expression
Stage
Other cell groups
all cells
blastomeres
PGCs
endoderm
axial mesoderm
muscle
mural cells /
non-skeletal muscle
mesenchyme
hematopoietic /
vasculature
pronephros
neural
spinal cord / glia
eye
taste / olfactory
otic / lateral line
epidermis
periderm
fin
ionocytes / mucous
pigment cells
Expression by stage/cluster
Correlated gene expression
Positive correlation
Negative correlation
Gene
r
Gene
r
si:dkey-222b8.4
0.272
cebpd
-0.064
pfkmb
0.200
zgc:162730
-0.059
BX248510.2
0.191
ifitm1
-0.056
LOC101883766
0.184
CR383676.1
-0.056
cfap43
0.181
dap1b
-0.055
CR848723.1
0.179
ier2b
-0.054
LOC110439831
0.179
apoa2
-0.049
cart2
0.177
mt-co2
-0.048
XLOC-019725
0.177
aoc2
-0.048
ttc41
0.175
sparc
-0.045
lrrc18a
0.163
fermt2
-0.043
fmnl1a
0.160
tmsb4x
-0.043
osbpl7
0.160
igfbp7
-0.042
ehd2a
0.159
rbp4
-0.042
AL935303.1
0.159
tob1b
-0.041
PLEKHB1
0.156
krt8
-0.040
cacna1fa
0.153
pvalb1
-0.039
si:dkey-33m11.8
0.152
cavin2b
-0.039
slc22a5
0.145
ehd2b
-0.039
si:dkeyp-82h4.1
0.143
ctrb1
-0.039
lhfpl5b
0.143
si:dkey-7j14.6
-0.038
BX469885.1
0.141
tpm1
-0.038
BX640520.1
0.140
ddit3
-0.038
LOC110439787
0.136
itgb3b
-0.037
kdf1a
0.134
si:dkey-238c7.16
-0.036
si:dkeyp-73a2.2
0.134
si:ch211-62a1.3
-0.036
cfap161
0.131
serinc1
-0.036
otop2
0.128
COX3
-0.035
ftr22
0.128
pabpc1b
-0.035
slco1e1
0.128
stat1a
-0.035
XLOC-021234
0.125
ctsla
-0.035
si:ch1073-140o9.2
0.122
spon1b
-0.035
theg
0.121
krt17
-0.035
zgc:194007
0.120
apoa1b
-0.035
XLOC-042220
0.120
si:ch211-195b11.3
-0.034