Daniocell
erich2 (ionocytes / mucous-producing)
glutamate-rich 2
ZFIN
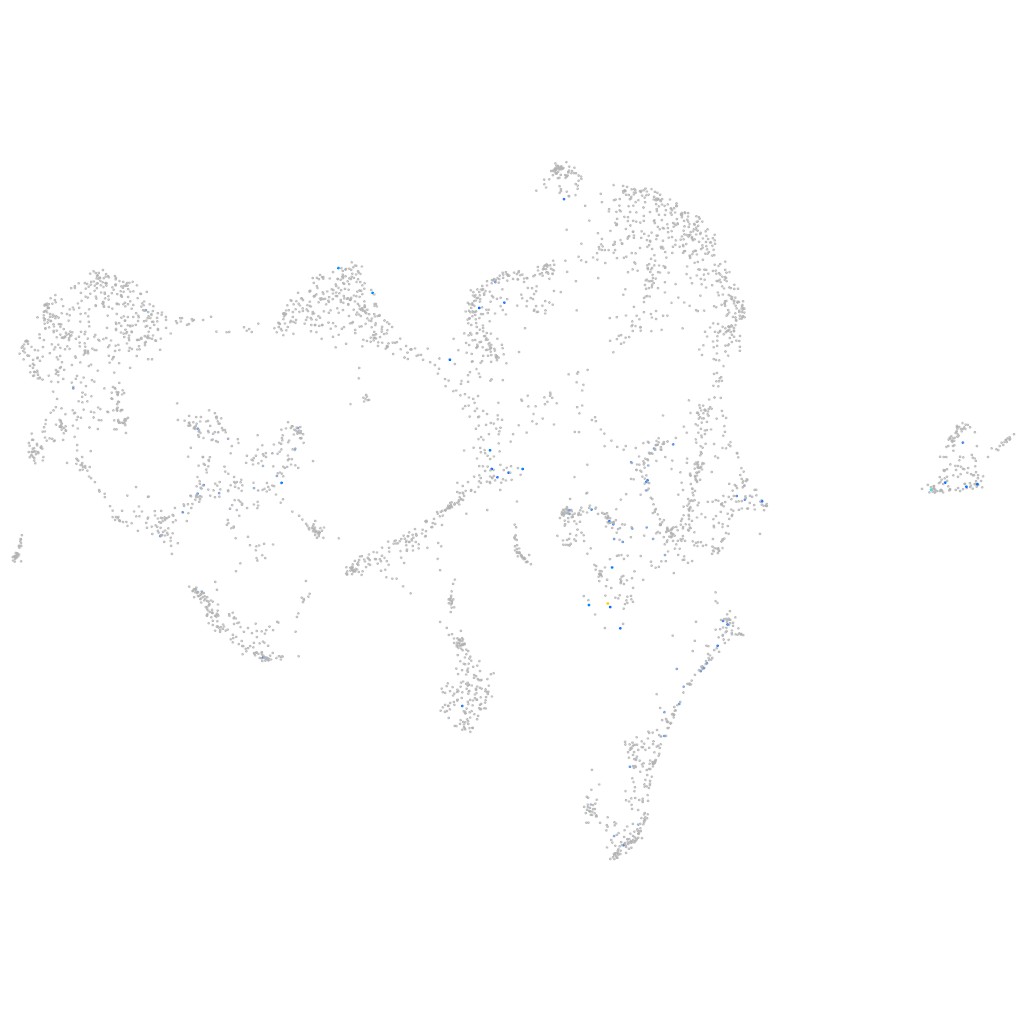
Gene expression UMAP
Display:
Expression
Stage
Other cell groups
all cells
blastomeres
PGCs
endoderm
axial mesoderm
muscle
mural cells /
non-skeletal muscle
mesenchyme
hematopoietic /
vasculature
pronephros
neural
spinal cord / glia
eye
taste / olfactory
otic / lateral line
epidermis
periderm
fin
ionocytes / mucous
pigment cells
Expression by stage/cluster
Correlated gene expression
Positive correlation
Negative correlation
Gene
r
Gene
r
ccdc175
0.453
selenow1
-0.106
LOC100536937
0.453
icn
-0.088
znf1166
0.453
icn2
-0.076
CU550719.2
0.453
zgc:110333
-0.073
si:dkey-222b8.4
0.442
krt91
-0.071
dnaaf3l
0.429
cst14b.1
-0.068
lrguk
0.418
tmem59
-0.067
wdr27
0.403
si:dkey-248g15.3
-0.064
CU633857.1
0.399
wu:fb18f06
-0.064
rsph3
0.390
si:dkey-193p11.2
-0.064
drc1
0.383
aldob
-0.064
lrrc51
0.380
malb
-0.064
si:ch1073-181h11.2
0.376
zgc:193505
-0.062
cfap100
0.374
ahnak
-0.061
si:dkeyp-86c4.1
0.369
znf185
-0.061
cfap300
0.362
krt5
-0.061
c18h15orf65
0.352
fuca2
-0.060
si:dkeyp-69c1.9
0.342
krt4
-0.060
got1l1
0.333
abcb5
-0.060
tbata
0.330
BX000438.2
-0.059
spata18
0.326
hrc
-0.059
CR855277.2
0.323
gmds
-0.059
mustn1a
0.317
spint2
-0.058
nme5
0.301
itm2bb
-0.058
ccdc146
0.298
DSG2
-0.057
cd37
0.289
si:dkey-33i11.9
-0.057
dnali1
0.289
cd63
-0.056
znf1016
0.280
pof1b
-0.056
gmnc
0.275
hdlbpa
-0.056
ccdc13
0.274
si:dkey-204f11.64
-0.054
dnaaf4
0.273
cyt1l
-0.054
katnal2
0.270
muc5.1
-0.054
tekt1
0.270
tfap2a
-0.054
akna
0.268
si:ch211-195b11.3
-0.053
foxj1b
0.266
si:dkey-87o1.2
-0.053