Daniocell
ercc6l2 (pronephros)
excision repair cross-complementation group 6-like 2
ZFIN
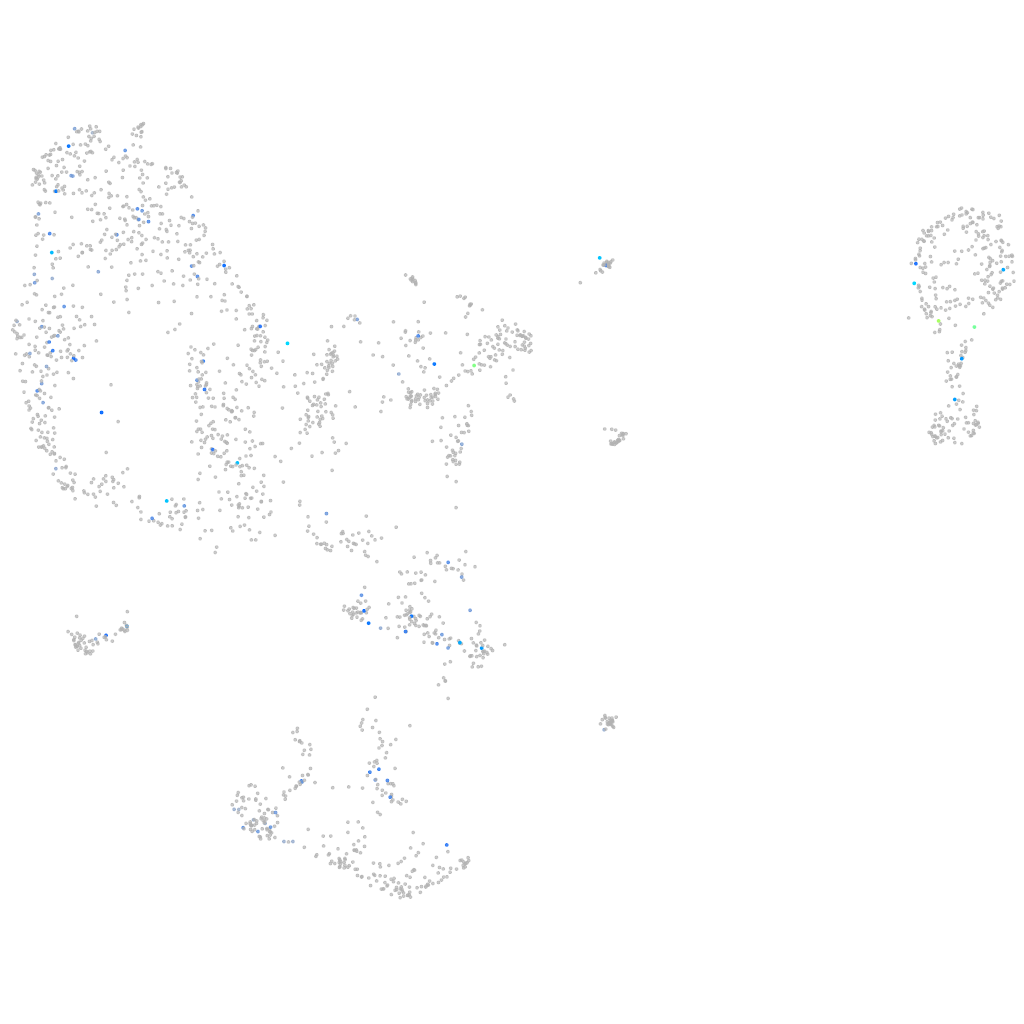
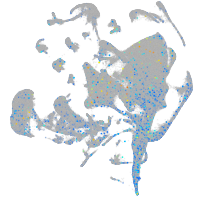
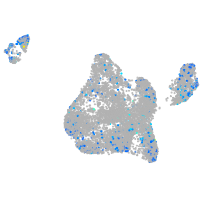
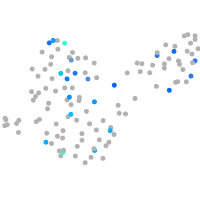
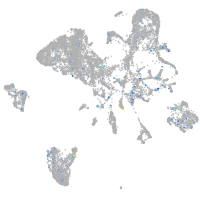
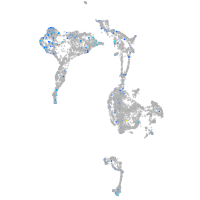
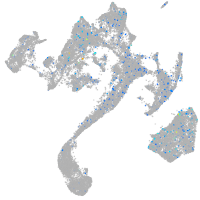
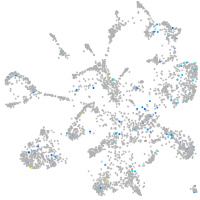
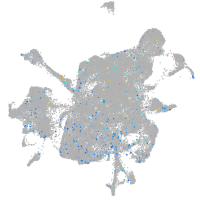
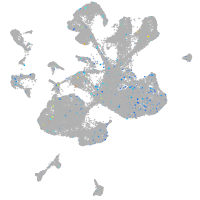
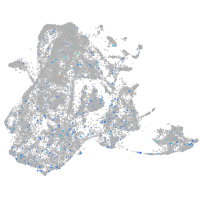
Gene expression UMAP
Display:
Expression
Stage
Other cell groups
all cells
blastomeres
PGCs
endoderm
axial mesoderm
muscle
mural cells /
non-skeletal muscle
mesenchyme
hematopoietic /
vasculature
pronephros
neural
spinal cord / glia
eye
taste / olfactory
otic / lateral line
epidermis
periderm
fin
ionocytes / mucous
pigment cells
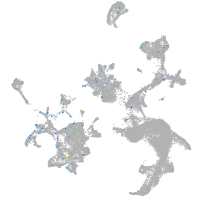
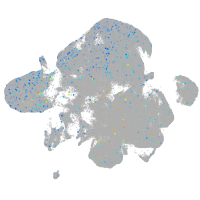
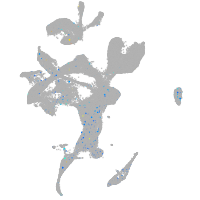
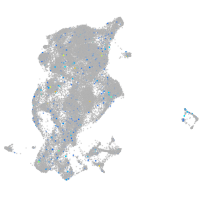
Expression by stage/cluster
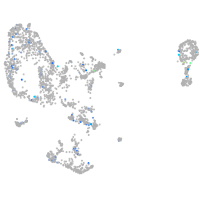
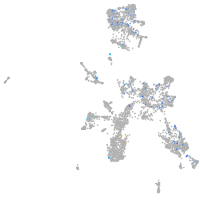
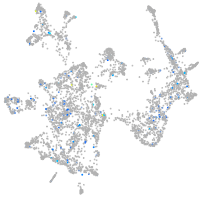
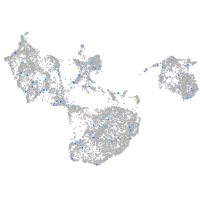
Correlated gene expression
Positive correlation
Negative correlation
Gene
r
Gene
r
LOC101882857
0.285
ets2
-0.050
galnt8b.1
0.269
wdfy3
-0.048
irf1a
0.240
tiparp
-0.047
vwa10.2
0.235
grk3
-0.047
zgc:165514
0.233
actc1b
-0.045
XLOC-017191
0.220
pvalb2
-0.045
zgc:153431
0.218
abt1
-0.041
si:dkeyp-92c9.2
0.199
ctgfa
-0.040
si:dkey-238k10.3
0.192
gadd45bb
-0.040
fam20ca
0.192
MED9
-0.040
CABZ01077220.1
0.184
actb2
-0.039
LOC103909205
0.182
adipor2
-0.039
si:dkey-22i16.7
0.174
hnrnpr
-0.037
LOC108183291
0.173
trim35-12
-0.037
si:ch211-286b5.8
0.172
sncb
-0.037
si:ch211-253p18.2
0.169
mex3b
-0.037
LOC110438006
0.166
dot1l
-0.037
LOC110439565
0.165
rpl38
-0.037
XLOC-020238
0.160
actb1
-0.036
LO018333.1
0.159
ttc4
-0.036
LOC103910512
0.159
tcnbb
-0.036
mllt3
0.158
pim1
-0.035
rad9b
0.158
raf1b
-0.035
radx
0.158
ckba
-0.035
LOC103911089
0.157
flot2a
-0.035
htr1fb
0.156
XLOC-043659
-0.035
CR550302.2
0.156
CR855389.1
-0.035
gpr75
0.155
pold3
-0.035
si:dkeyp-80c12.8
0.154
usp6nl
-0.035
LOC101886598
0.154
sars
-0.035
prokr1a
0.153
slc20a1b
-0.034
LOC110440196
0.151
cox5b2
-0.034
XLOC-019696
0.149
gng3
-0.034
col17a1b
0.149
vash2
-0.034
fbxo40.1
0.149
atp6v0cb
-0.034