Daniocell
efna5b (pronephros)
ephrin-A5b
ZFIN
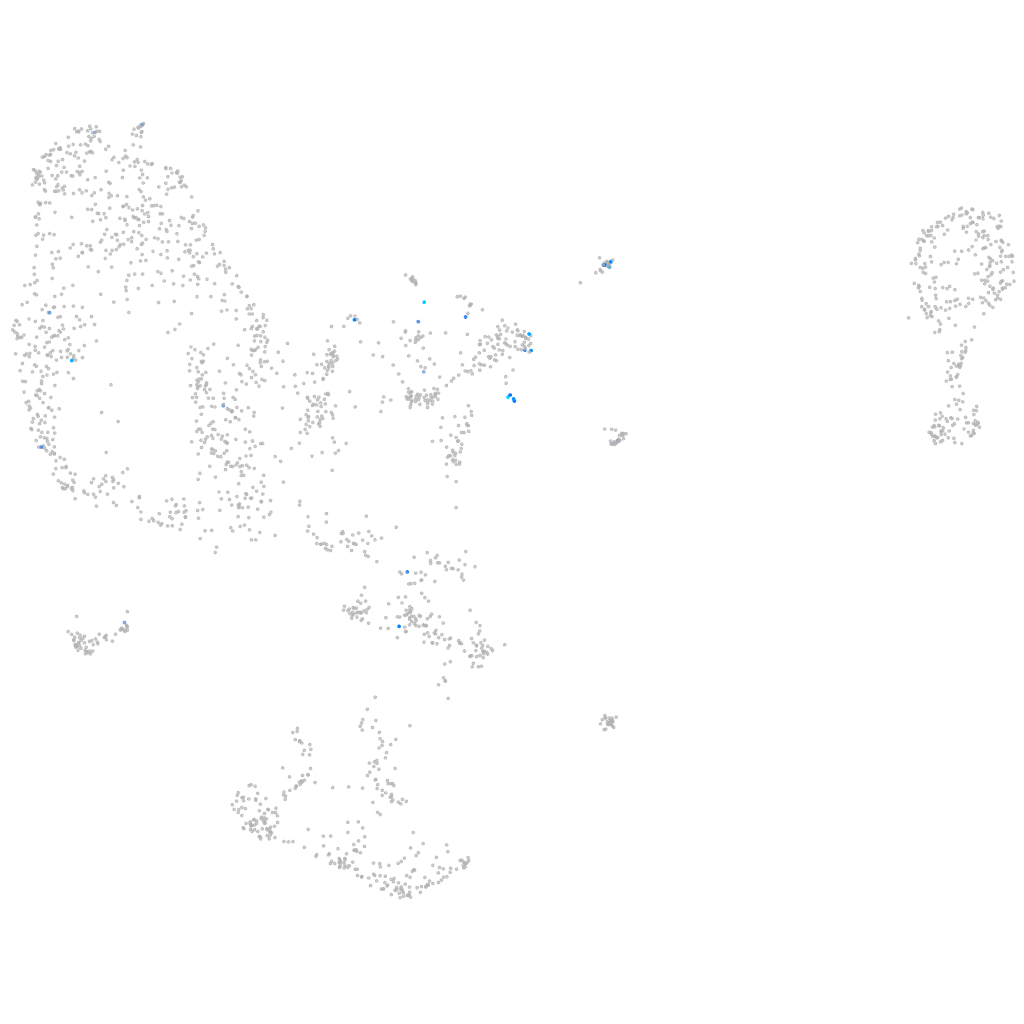
Gene expression UMAP
Display:
Expression
Stage
Other cell groups
all cells
blastomeres
PGCs
endoderm
axial mesoderm
muscle
mural cells /
non-skeletal muscle
mesenchyme
hematopoietic /
vasculature
pronephros
neural
spinal cord / glia
eye
taste / olfactory
otic / lateral line
epidermis
periderm
fin
ionocytes / mucous
pigment cells
Expression by stage/cluster
Correlated gene expression
Positive correlation
Negative correlation
Gene
r
Gene
r
gfra4b
0.486
NC-002333.4
-0.074
calca
0.484
atp5f1d
-0.070
scn4ab
0.471
ndufab1a
-0.067
cx39.4
0.436
cox7c
-0.067
panx3
0.434
cdaa
-0.066
LOC101885859
0.388
cdh17
-0.065
gck
0.368
atp1a1a.4
-0.064
si:dkey-90l8.3
0.368
npm1a
-0.063
si:dkey-208c12.2
0.360
uqcrfs1
-0.061
XLOC-003136
0.359
gadd45gip1
-0.060
LOC101882766
0.359
bin2a
-0.060
nr0b1
0.351
atp5mc1
-0.060
grem2b
0.343
ndufa7
-0.059
scin
0.335
chchd10
-0.059
CR407550.1
0.324
cox6a2
-0.059
nr5a2
0.318
cycsb
-0.059
gpx2
0.317
srsf1a
-0.058
sstr2a
0.312
hspe1
-0.057
slc22a17
0.310
tspan35
-0.057
cyp2r1
0.310
tmprss2
-0.057
si:ch211-197f20.1
0.306
atp5md
-0.056
si:dkey-234i14.3
0.303
cox5ab
-0.056
LOC110438024
0.296
si:ch211-162e15.3
-0.055
LOC101883592
0.295
c1qbp
-0.055
kcnh3
0.292
cox6b1
-0.054
LOC101882034
0.287
chchd1
-0.054
otog
0.282
zgc:101040
-0.054
BX323839.1
0.279
lyrm7
-0.053
prlhr2a
0.274
pdzk1
-0.053
LOC101884186
0.274
mrpl33
-0.053
LOC110437787
0.274
dhfr
-0.053
si:ch1073-204b8.1
0.274
sgk2a
-0.053
rapgef4
0.271
acy3.2
-0.053
xkr9
0.271
cldnh
-0.053
XLOC-043020
0.270
si:ch211-139a5.9
-0.052