Daniocell
efna5b (axial mesoderm)
ephrin-A5b
ZFIN
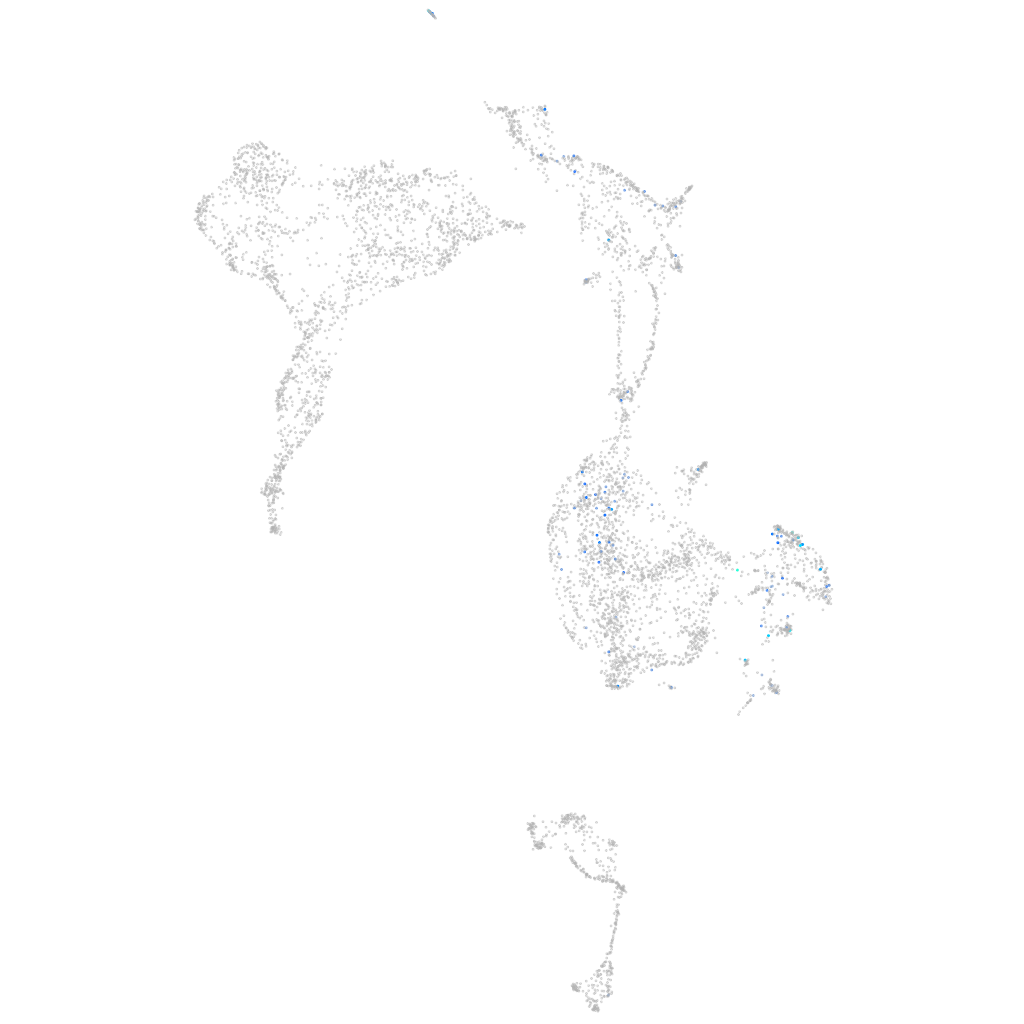
Gene expression UMAP
Display:
Expression
Stage
Other cell groups
all cells
blastomeres
PGCs
endoderm
axial mesoderm
muscle
mural cells /
non-skeletal muscle
mesenchyme
hematopoietic /
vasculature
pronephros
neural
spinal cord / glia
eye
taste / olfactory
otic / lateral line
epidermis
periderm
fin
ionocytes / mucous
pigment cells
Expression by stage/cluster
Correlated gene expression
Positive correlation
Negative correlation
Gene
r
Gene
r
XLOC-042917
0.248
npm1a
-0.076
XLOC-011861
0.240
nop58
-0.074
crygmxl2
0.239
dkc1
-0.072
kcnj1a.5
0.233
cited4b
-0.071
LOC108179567
0.224
hspb1
-0.071
tnfsf11
0.221
stm
-0.071
FP101883.1
0.220
nop56
-0.070
ccdc166
0.214
NC-002333.4
-0.068
adgre5b.2
0.204
fbl
-0.068
CR855257.2
0.193
sec61b
-0.067
CU137680.1
0.193
arf1
-0.067
dao.2
0.191
ddx18
-0.063
CABZ01050944.1
0.185
rsl1d1
-0.062
AL935145.2
0.184
nop2
-0.062
XLOC-026836
0.182
bms1
-0.061
spef2
0.182
snrpa
-0.061
f7i
0.179
metap2b
-0.060
LOC101884899
0.173
ncl
-0.060
LOC110438540
0.172
s100a1
-0.060
LOC103910812
0.171
lig1
-0.060
XLOC-034224
0.170
ppig
-0.059
tmem176
0.170
eif2s1a
-0.059
CT573103.1
0.166
rbm4.3
-0.059
cntfr
0.160
tpx2
-0.059
LOC108191505
0.160
mphosph10
-0.059
CABZ01078734.1
0.159
safb
-0.059
mmp25b
0.159
anp32e
-0.059
znf1102
0.157
tbx16
-0.059
dync1i1
0.156
si:dkey-92i17.2
-0.058
LOC103910718
0.155
polr3gla
-0.058
tpst2
0.154
srrt
-0.058
LO018585.1
0.154
zmp:0000000624
-0.058
zmp:0000000937
0.154
fth1a
-0.058
si:ch211-59p23.1
0.153
wdr43
-0.058
stmn1b
0.152
zgc:110425
-0.058