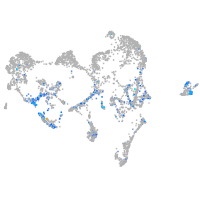
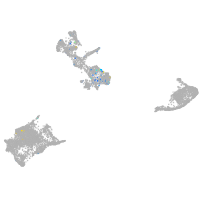
dachshund c
ZFIN 
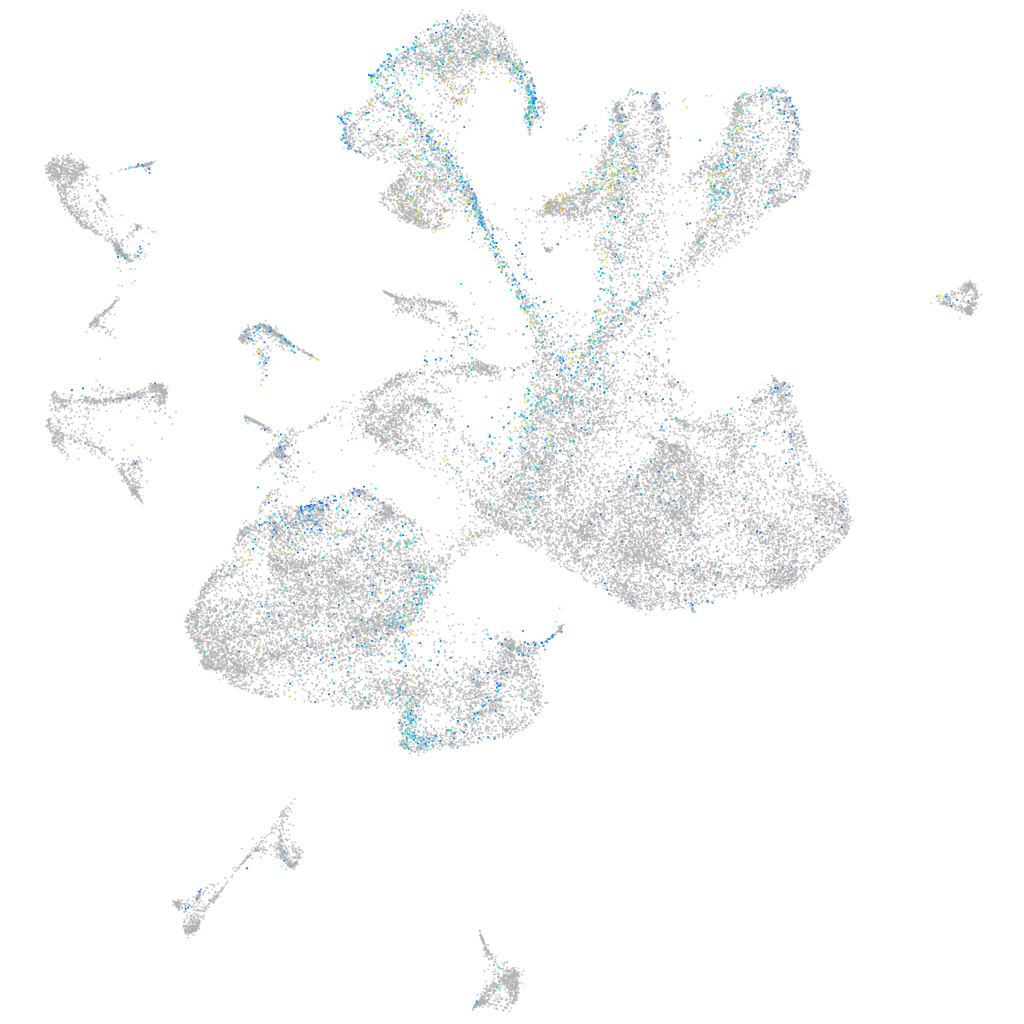
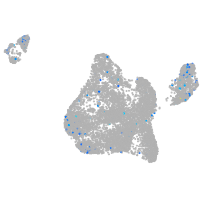
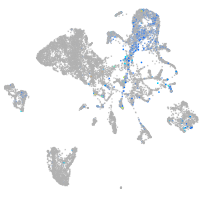
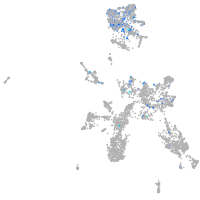
Expression by stage/cluster


Correlated gene expression


| Positive correlation | Negative correlation | ||
| Gene | r | Gene | r |
| elavl3 | 0.151 | id1 | -0.071 |
| myt1b | 0.135 | dut | -0.070 |
| lhx4 | 0.128 | mdka | -0.070 |
| neurod1 | 0.114 | hmgb2a | -0.069 |
| elavl4 | 0.112 | si:ch73-265d7.2 | -0.068 |
| runx1t1 | 0.110 | pcna | -0.067 |
| rtn1a | 0.110 | sparc | -0.067 |
| dlb | 0.109 | fosab | -0.065 |
| srrm4 | 0.109 | her8a | -0.065 |
| insm1a | 0.108 | msna | -0.063 |
| ywhah | 0.106 | atp1a1b | -0.062 |
| sox4a | 0.106 | vamp3 | -0.062 |
| ebf2 | 0.104 | stmn1a | -0.062 |
| stmn1b | 0.103 | selenoh | -0.061 |
| esrrga | 0.101 | zgc:56493 | -0.061 |
| nhlh2 | 0.101 | nutf2l | -0.061 |
| hmgb3a | 0.100 | tuba8l | -0.060 |
| nova2 | 0.099 | ndnf | -0.060 |
| cbfa2t3 | 0.097 | si:ch211-286o17.1 | -0.060 |
| scrt2 | 0.097 | ccng1 | -0.060 |
| golga7ba | 0.095 | cd82a | -0.059 |
| tmsb | 0.095 | cdca7b | -0.059 |
| si:ch211-193l2.6 | 0.093 | rpa3 | -0.056 |
| tubb5 | 0.093 | psph | -0.056 |
| nova1 | 0.093 | lbr | -0.055 |
| baz2ba | 0.092 | banf1 | -0.055 |
| lmo4b | 0.092 | tuba8l4 | -0.055 |
| casz1 | 0.090 | ptgr1 | -0.055 |
| clvs2 | 0.090 | cldn5a | -0.054 |
| gng2 | 0.090 | cdx4 | -0.054 |
| elovl4a | 0.090 | mapk12b | -0.054 |
| dpysl3 | 0.090 | rplp1 | -0.054 |
| bcl11ba | 0.090 | her2 | -0.054 |
| pacsin1b | 0.089 | gas1b | -0.054 |
| pik3r3b | 0.089 | dek | -0.054 |


