
"cysteine-rich, angiogenic inducer, 61 [Source:ZFIN;Acc:ZDB-GENE-040426-3]"
ZFIN 
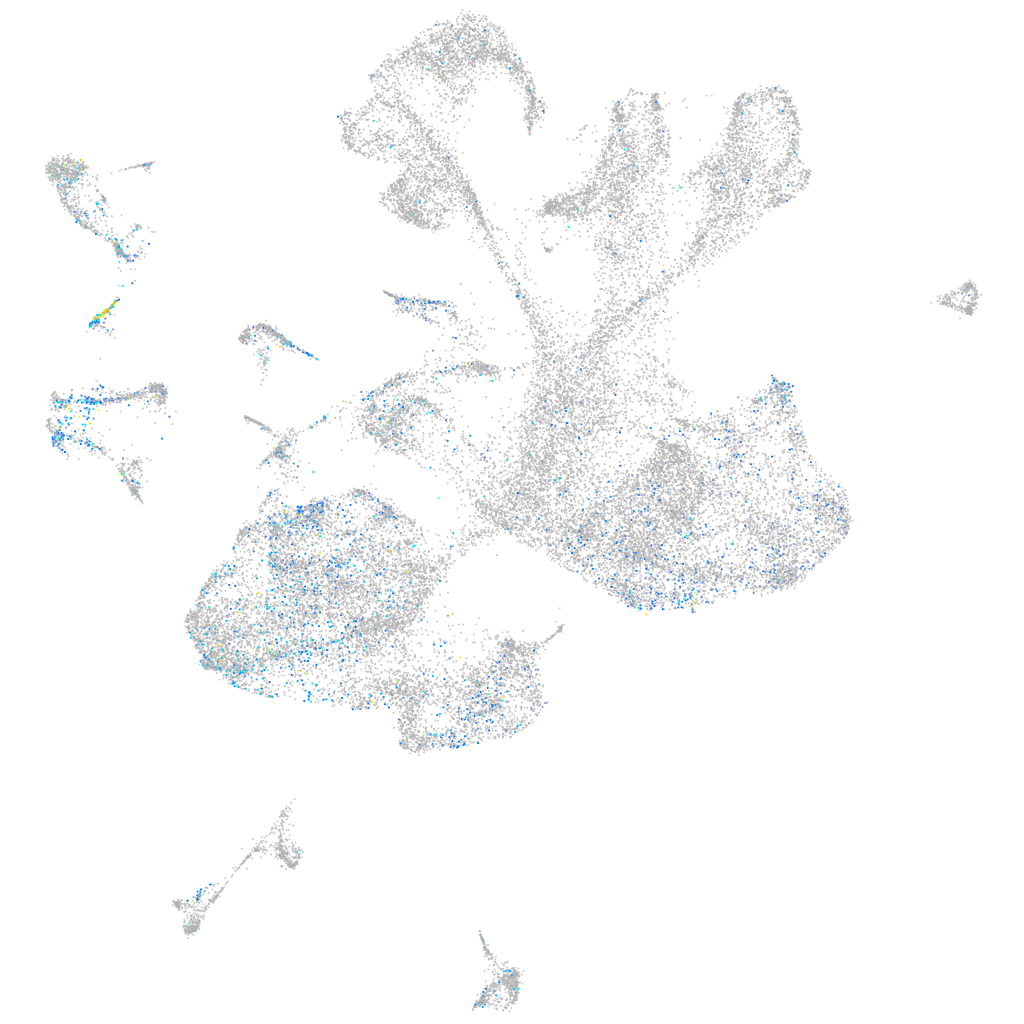
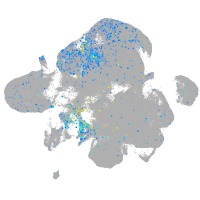
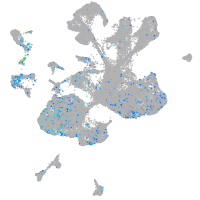
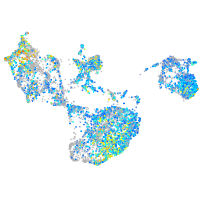
Gene expression UMAP


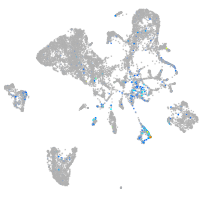
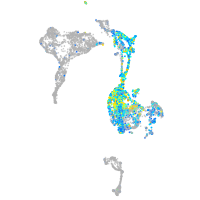


Expression by stage/cluster
Correlated gene expression
| Positive correlation | Negative correlation | ||
| Gene | r | Gene | r |
| twist2 | 0.286 | elavl3 | -0.124 |
| si:ch211-157b11.8 | 0.242 | ptmaa | -0.113 |
| spon2a | 0.236 | myt1b | -0.105 |
| timp4.1 | 0.231 | ptmab | -0.103 |
| kng1 | 0.229 | sox11b | -0.094 |
| angpt1 | 0.216 | hmgb3a | -0.092 |
| matn3b | 0.215 | rtn1a | -0.091 |
| col8a1a | 0.215 | myt1a | -0.089 |
| pgfb | 0.206 | tmsb | -0.088 |
| col2a1b | 0.205 | nova2 | -0.086 |
| ptx3a | 0.204 | tuba1c | -0.085 |
| col8a1b | 0.202 | tubb5 | -0.084 |
| rspo3 | 0.201 | tmeff1b | -0.084 |
| optc | 0.200 | si:dkey-276j7.1 | -0.083 |
| col9a3 | 0.200 | hmgb1a | -0.083 |
| col9a1b | 0.199 | fabp3 | -0.080 |
| cnmd | 0.197 | h3f3d | -0.079 |
| fbn2b | 0.197 | si:ch73-386h18.1 | -0.079 |
| ntd5 | 0.191 | gng3 | -0.078 |
| col2a1a | 0.188 | zc4h2 | -0.078 |
| col5a1 | 0.187 | stmn1b | -0.078 |
| plod2 | 0.178 | sncb | -0.076 |
| tmem154 | 0.177 | stxbp1a | -0.076 |
| aplnr2 | 0.174 | elavl4 | -0.074 |
| fhl2a | 0.173 | hnrnpaba | -0.074 |
| igf2b | 0.168 | si:dkey-56m19.5 | -0.073 |
| fkbp7 | 0.166 | stx1b | -0.073 |
| anxa4 | 0.163 | marcksb | -0.073 |
| col9a2 | 0.163 | si:ch73-21g5.7 | -0.072 |
| matn4 | 0.162 | LOC100537384 | -0.071 |
| cers3b | 0.161 | snap25a | -0.071 |
| tmem119a | 0.160 | nsg2 | -0.069 |
| sema3bl | 0.160 | scrt2 | -0.069 |
| foxa3 | 0.159 | chd4a | -0.069 |
| tpm4a | 0.159 | si:ch211-57n23.4 | -0.068 |