Daniocell
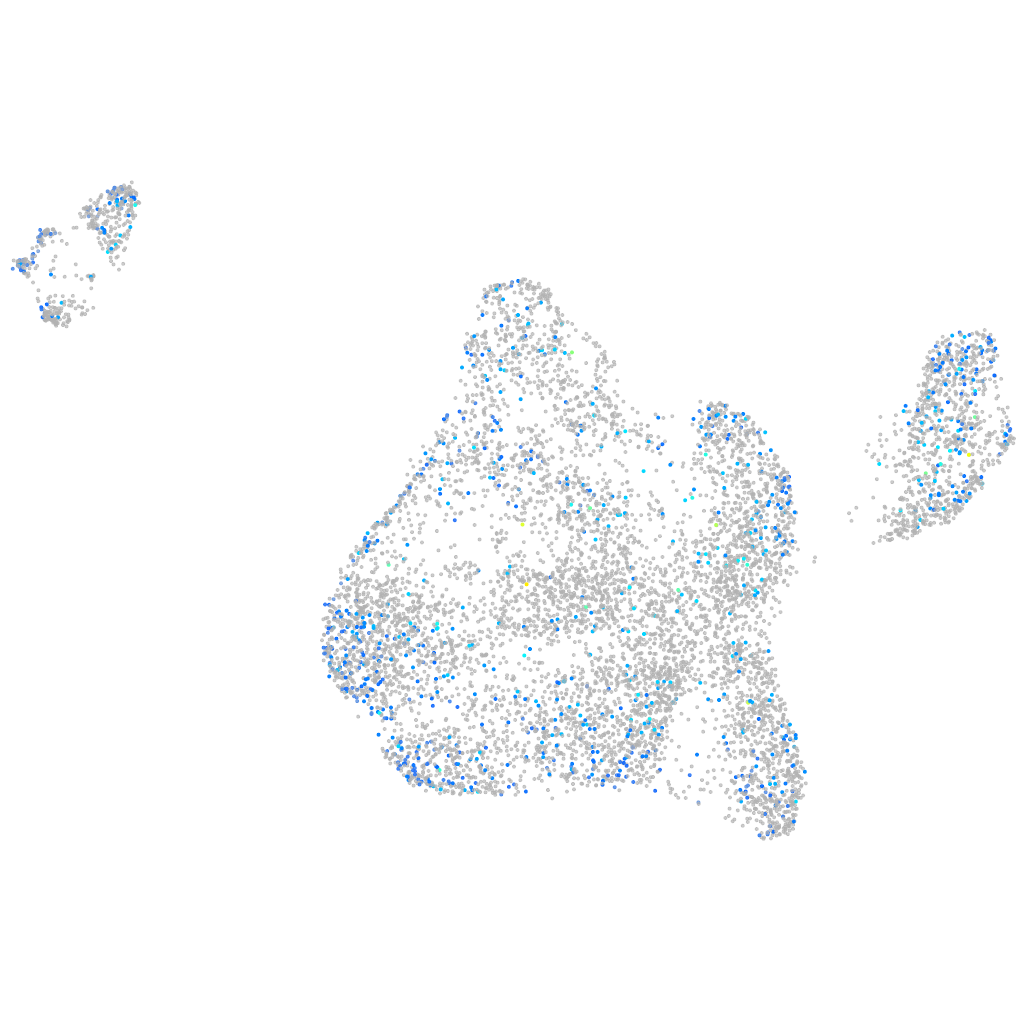
cyb5b (blastomeres)
cytochrome b5 type B
ZFIN
Gene expression UMAP
Display:
Expression
Stage
Other cell groups
all cells
blastomeres
PGCs
endoderm
axial mesoderm
muscle
mural cells /
non-skeletal muscle
mesenchyme
hematopoietic /
vasculature
pronephros
neural
spinal cord / glia
eye
taste / olfactory
otic / lateral line
epidermis
periderm
fin
ionocytes / mucous
pigment cells
Expression by stage/cluster
Correlated gene expression
Positive correlation
Negative correlation
Gene
r
Gene
r
txnipb
0.089
NC-002333.4
-0.059
rbm7
0.076
eef1a1l1
-0.035
LOC110438671
0.070
npm1a
-0.033
CR545469.1
0.069
ybx1
-0.033
camk2d1
0.067
si:dkey-3p4.8
-0.033
tarbp2
0.066
XLOC-039121
-0.032
si:dkey-68o6.5
0.064
crabp2b
-0.032
dnajb1b
0.064
si:ch73-141c7.1
-0.030
LOC793648
0.064
hmga1a
-0.030
hmgcll1
0.063
zgc:92242
-0.030
CR556712.1
0.061
si:ch73-1a9.3
-0.029
gdf3
0.060
BX927258.1
-0.029
tcnbb
0.060
psmb7
-0.028
lsm14aa
0.060
si:dkeyp-2e4.3
-0.027
mapkapk2a
0.060
hmgb2a
-0.027
dnajc1
0.060
mdka
-0.027
ilvbl
0.059
phykpl
-0.026
gpx8
0.059
hmgn6
-0.026
gper1
0.058
LOC101882667
-0.026
LOC103909472
0.058
tfap2a
-0.026
si:ch211-121j5.4
0.058
prdm2b
-0.026
ccna2
0.058
XLOC-032526
-0.026
htatsf1
0.057
si:ch73-281n10.2
-0.025
CR788311.1
0.057
pir
-0.025
AL935174.5
0.057
si:dkey-23a13.17
-0.025
gtf2a1
0.057
LOC108190056
-0.025
stk35l
0.057
LOC100151145
-0.025
blf
0.056
epha2b
-0.025
neu4
0.056
gas6
-0.024
nanog
0.055
mt-atp8
-0.024
mkrn4
0.055
CR388206.1
-0.024
pho
0.055
znf1083
-0.024
cdca7a
0.055
XLOC-026578
-0.024
si:ch211-231i17.3
0.055
cst14a.1
-0.024
pacsin2
0.055
flrt3
-0.023