Daniocell
cyb5b (pronephros)
cytochrome b5 type B
ZFIN
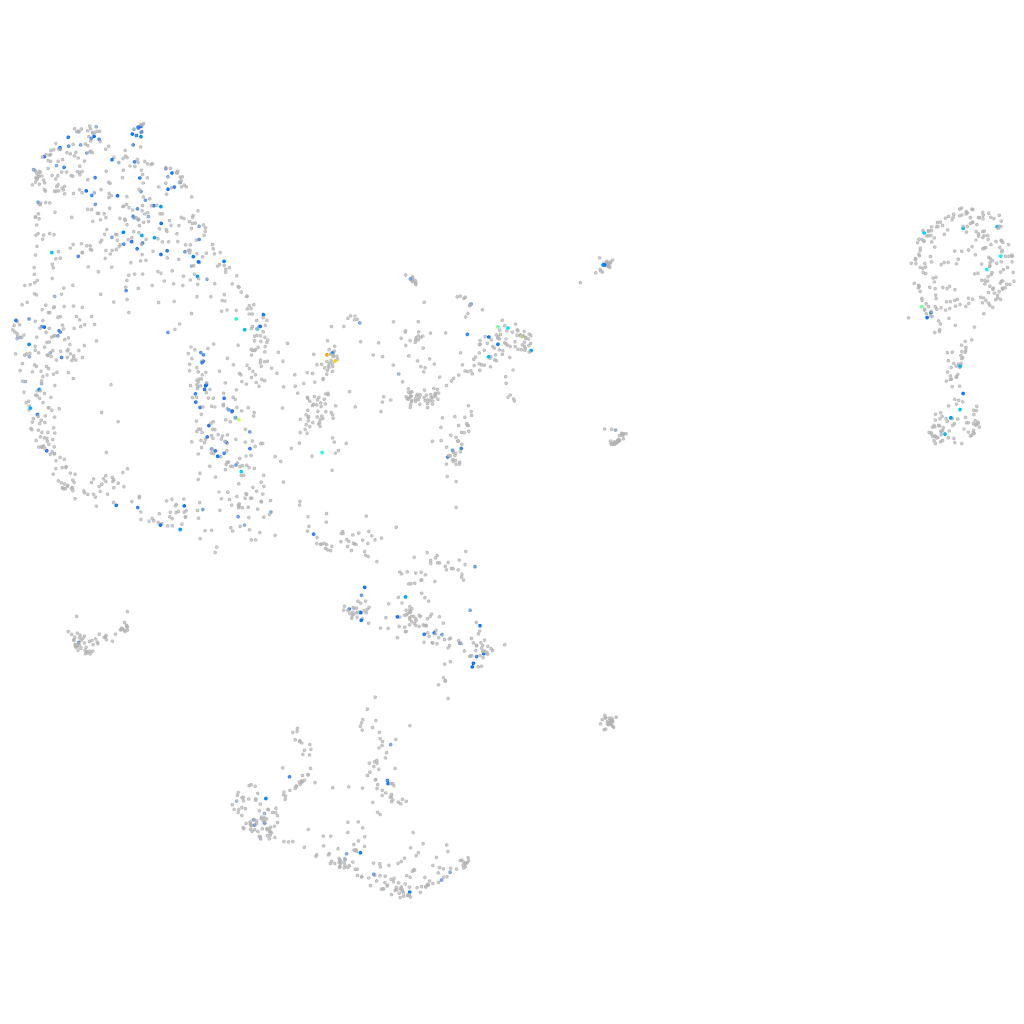
Gene expression UMAP
Display:
Expression
Stage
Other cell groups
all cells
blastomeres
PGCs
endoderm
axial mesoderm
muscle
mural cells /
non-skeletal muscle
mesenchyme
hematopoietic /
vasculature
pronephros
neural
spinal cord / glia
eye
taste / olfactory
otic / lateral line
epidermis
periderm
fin
ionocytes / mucous
pigment cells
Expression by stage/cluster
Correlated gene expression
Positive correlation
Negative correlation
Gene
r
Gene
r
pimr90
0.241
cfl1l
-0.078
spi2
0.222
tpm4a
-0.072
LOC103911903
0.214
pleca
-0.070
LOC110440174
0.214
slc43a1a
-0.067
trpa1b
0.213
kif22
-0.065
cacna1ab
0.200
si:ch73-359m17.9
-0.064
nxph3
0.197
txnipa
-0.063
btbd3b
0.191
eef1a1l1
-0.062
adkb
0.191
tbx2b
-0.062
malrd1
0.180
phlda2
-0.062
fam19a1a
0.180
hmgb2a
-0.062
zgc:73359
0.180
si:dkey-36i7.3
-0.061
pbldp
0.178
tmem72
-0.060
bcl2b
0.172
pnrc2
-0.060
CT737184.1
0.170
pdlim1
-0.060
si:ch211-215p11.1
0.164
prrg2
-0.059
si:ch1073-391i24.1
0.163
agr2
-0.059
BX539313.1
0.163
tmem54a
-0.059
CR352226.3
0.163
eps8l1b
-0.058
anks1ab
0.161
zgc:110425
-0.058
rgs20
0.158
birc5a
-0.058
pcdh1g22
0.158
ctgfa
-0.058
XLOC-011956
0.158
ahnak
-0.058
rassf4a
0.158
tmsb1
-0.057
si:ch211-151m7.6
0.157
prps1b
-0.057
BX323575.1
0.154
gpa33a
-0.057
scpep1
0.153
cmbl
-0.057
si:dkey-16p19.8
0.150
depdc7a
-0.057
prelid3a
0.150
ube2s
-0.057
BX511120.1
0.149
prc1a
-0.057
LOC103910179
0.148
trim35-12
-0.057
plscr3a
0.146
icn
-0.056
LOC110439385
0.145
bsnd
-0.056
ctsz
0.145
si:ch73-1a9.3
-0.056
cln5
0.144
fabp3
-0.056