Daniocell
crybb1 (glial cells / spinal cord)
"crystallin, beta B1"
ZFIN
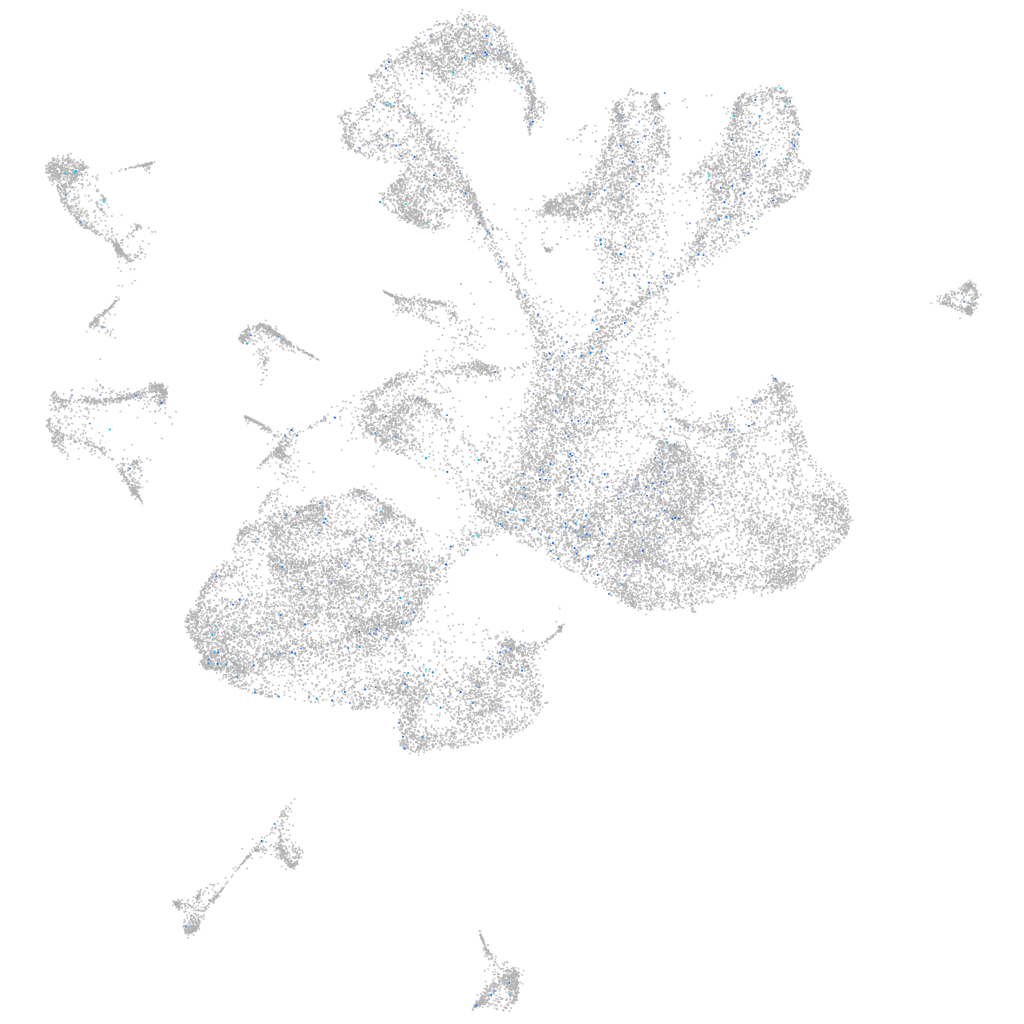
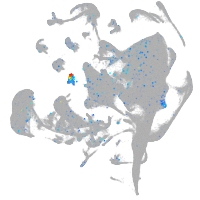
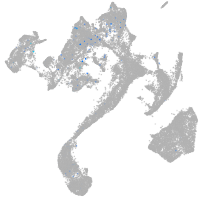
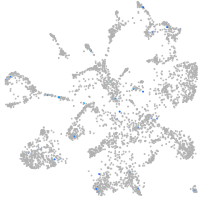
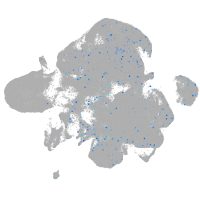
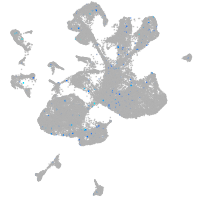
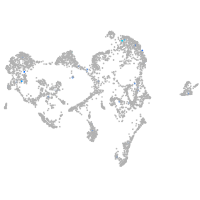
Gene expression UMAP
Display:
Expression
Stage
Other cell groups
all cells
blastomeres
PGCs
endoderm
axial mesoderm
muscle
mural cells /
non-skeletal muscle
mesenchyme
hematopoietic /
vasculature
pronephros
neural
spinal cord / glia
eye
taste / olfactory
otic / lateral line
epidermis
periderm
fin
ionocytes / mucous
pigment cells
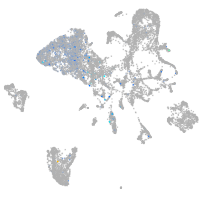
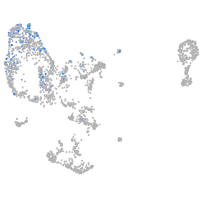
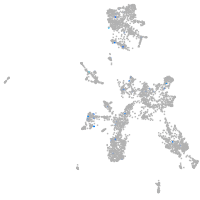
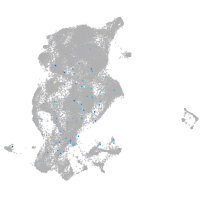
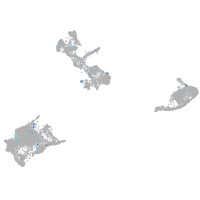
Expression by stage/cluster
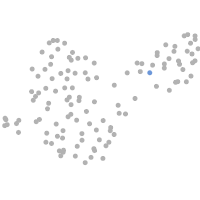
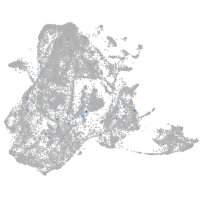
Correlated gene expression
Positive correlation
Negative correlation
Gene
r
Gene
r
LOC100537640
0.092
cdx4
-0.029
LOC100536192
0.086
gtpbp4
-0.025
crygn2
0.083
apela
-0.025
pigrl3.5
0.078
cad
-0.023
si:dkey-248f6.3
0.073
hspb1
-0.023
si:dkey-238k10.1
0.073
histh1l
-0.023
si:ch211-11p18.6.1
0.065
asb11
-0.023
XLOC-004014
0.065
uqcrh
-0.023
si:dkey-78l4.11
0.062
npm1a
-0.022
si:dkey-51d8.3
0.062
BX927258.1
-0.022
krt4
0.061
polr1d
-0.021
cyt1
0.056
si:ch211-217k17.7
-0.021
cyt1l
0.055
XLOC-042222
-0.021
LOC101883229
0.055
btf3
-0.020
XLOC-037221
0.055
znf593
-0.020
XLOC-032243
0.054
gar1
-0.020
cryba2b
0.054
XLOC-001964
-0.020
si:ch211-203k16.3
0.054
ccdc58
-0.020
ptx4
0.054
utp23
-0.020
tmc6a
0.052
paics
-0.020
XLOC-028659
0.050
faub
-0.019
icn2
0.050
dkc1
-0.019
LOC108183671
0.050
znf395a
-0.019
hbae1.1
0.049
lyar
-0.019
si:dkey-266f7.10
0.049
BX005254.3
-0.019
sema4aa
0.048
twsg1b
-0.019
LOC100329433
0.048
apoeb
-0.019
cryba4
0.048
fthl27
-0.019
actc1b
0.047
ucp2
-0.019
BX901898.2
0.047
ftsj3
-0.019
aep1
0.046
adi1
-0.019
icn
0.046
pdcd10b
-0.019
crybb1l1
0.045
pa2g4a
-0.019
LOC103911951
0.045
naca
-0.019
LOC101885311
0.044
nradd
-0.019