Daniocell
cpb1 (taste / olfactory)
carboxypeptidase B1 (tissue)
ZFIN
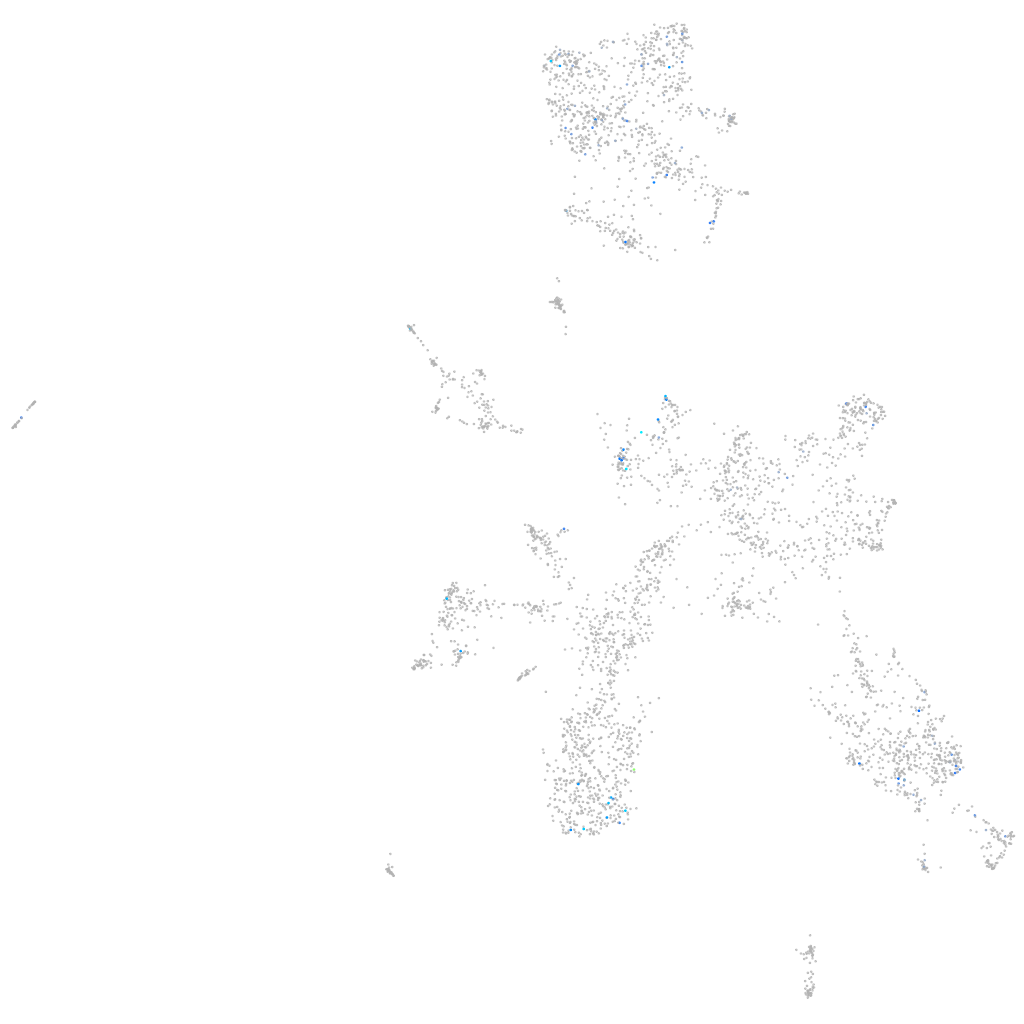
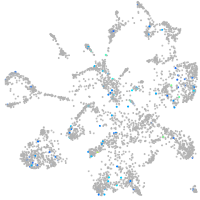
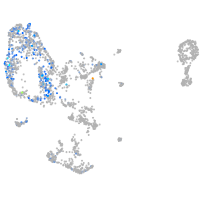
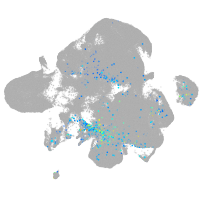
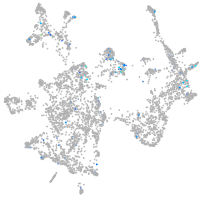
Gene expression UMAP
Display:
Expression
Stage
Other cell groups
all cells
blastomeres
PGCs
endoderm
axial mesoderm
muscle
mural cells /
non-skeletal muscle
mesenchyme
hematopoietic /
vasculature
pronephros
neural
spinal cord / glia
eye
taste / olfactory
otic / lateral line
epidermis
periderm
fin
ionocytes / mucous
pigment cells
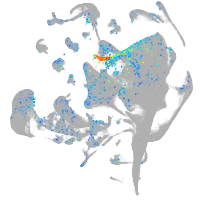
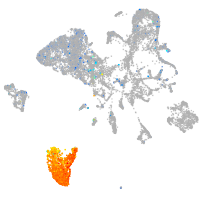
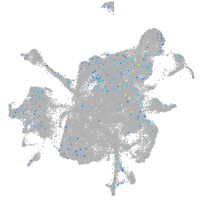
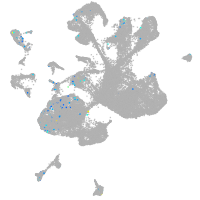
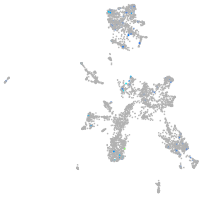
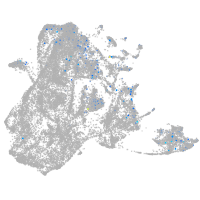
Expression by stage/cluster
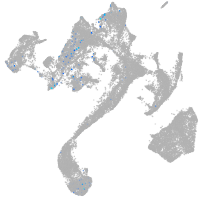
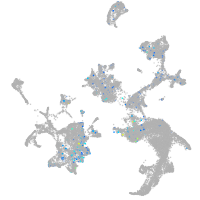
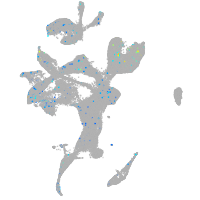
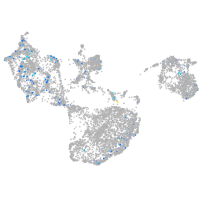
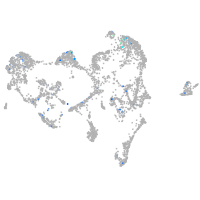
Correlated gene expression
Positive correlation
Negative correlation
Gene
r
Gene
r
LOC108183639
0.264
si:ch211-222l21.1
-0.095
SLC45A4 (1 of many)
0.220
hnrnpa0b
-0.082
LOC110438077
0.220
syncrip
-0.077
CABZ01077956.1
0.219
rpl19
-0.077
wscd2
0.210
marcksb
-0.077
si:ch73-248e21.7
0.195
hdac1
-0.076
BX005254.3
0.192
tmsb
-0.075
s1pr3a
0.185
ywhaz
-0.074
si:dkey-202c14.3
0.183
srsf3b
-0.074
prss1
0.182
hsp90ab1
-0.073
CR388413.4
0.179
hnrnpa0l
-0.072
prss59.2
0.178
ddx39ab
-0.072
abr
0.178
h3f3d
-0.071
znf1038
0.178
apex1
-0.070
XLOC-016343
0.176
si:ch211-288g17.3
-0.070
MFN1
0.171
hmga1a
-0.069
grm8a
0.170
smarce1
-0.069
crfb12
0.167
hnrnpaba
-0.068
LOC101886653
0.166
psmb6
-0.067
si:ch73-334d15.4
0.165
tubb2b
-0.067
ankrd6a
0.163
zgc:153409
-0.066
si:dkeyp-50f7.2
0.162
khdrbs1a
-0.066
BX957322.3
0.162
ywhae1
-0.065
prss59.1
0.161
hnrnpabb
-0.065
KCNN2
0.157
rab10
-0.064
cldn15lb
0.157
setb
-0.063
ctrb1
0.157
seta
-0.063
CT573282.1
0.155
snrpd2
-0.062
si:ch73-29l19.1
0.155
actl6a
-0.062
CABZ01072815.1
0.154
pak2b
-0.061
zgc:112160
0.153
rpl5b
-0.061
cpa5
0.152
bcas2
-0.061
LOC110440141
0.152
hmgn6
-0.061
CR356236.1
0.151
lmnb2
-0.060
adgrg3
0.149
rpl13a
-0.059