Daniocell
cfd (glial cells / spinal cord)
complement factor D (adipsin)
ZFIN
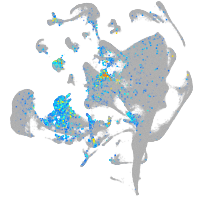
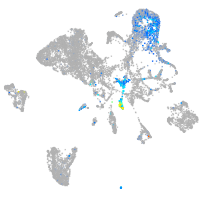
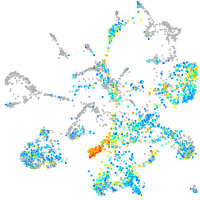
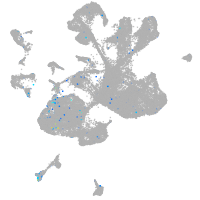
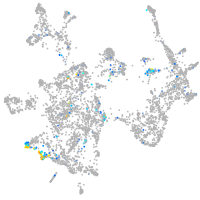
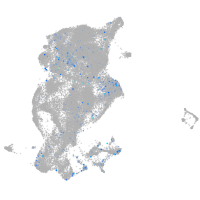
Gene expression UMAP
Display:
Expression
Stage
Other cell groups
all cells
blastomeres
PGCs
endoderm
axial mesoderm
muscle
mural cells /
non-skeletal muscle
mesenchyme
hematopoietic /
vasculature
pronephros
neural
spinal cord / glia
eye
taste / olfactory
otic / lateral line
epidermis
periderm
fin
ionocytes / mucous
pigment cells
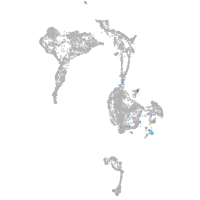
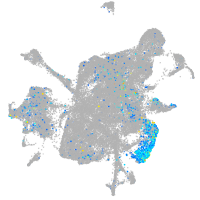
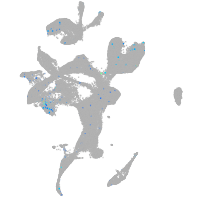
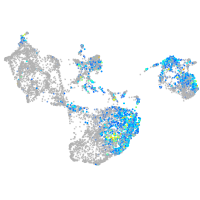
Expression by stage/cluster
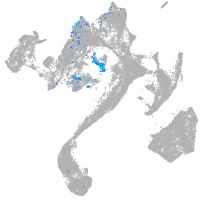
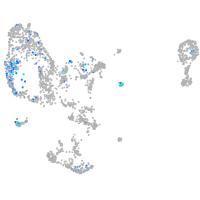
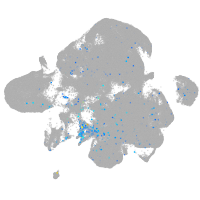
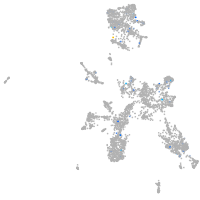
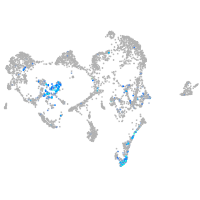
Correlated gene expression
Positive correlation
Negative correlation
Gene
r
Gene
r
slc16a9a
0.173
ptmab
-0.081
si:dkey-183j2.10
0.149
tubb2b
-0.077
si:dkey-200l5.4
0.141
hnrnpaba
-0.073
cdaa
0.127
h3f3d
-0.072
cd9b
0.126
khdrbs1a
-0.071
si:ch211-160j14.3
0.122
cirbpb
-0.071
ccka
0.118
si:ch73-1a9.3
-0.066
cx47.1
0.116
hnrnpa0l
-0.065
plp1b
0.114
hmga1a
-0.065
si:ch73-335m24.2
0.112
hsp90ab1
-0.065
acta2
0.110
cirbpa
-0.063
BX323839.1
0.105
si:ch211-222l21.1
-0.062
itgbl1
0.102
si:ch211-288g17.3
-0.061
nck1a
0.102
hnrnpa0b
-0.059
s100b
0.100
marcksb
-0.058
si:ch211-66e2.5
0.098
syncrip
-0.058
zgc:162331
0.097
h2afvb
-0.058
six6a
0.096
sumo3a
-0.054
tlcd1
0.095
h3f3a
-0.053
clic2
0.095
tuba1c
-0.053
cd226
0.094
rps26
-0.053
cox4i2
0.094
hmgn2
-0.053
cabp5a
0.094
hspa8
-0.053
XLOC-013964
0.091
rps5
-0.053
si:ch211-156j16.1
0.090
si:dkey-56m19.5
-0.053
cldnk
0.089
hmgn6
-0.052
mag
0.088
XLOC-003689
-0.052
sept8b
0.088
nucks1a
-0.052
si:dkey-164f24.2
0.087
tuba1a
-0.051
crp1
0.086
rpl10
-0.051
six6b
0.086
rpl18
-0.051
hpgd
0.086
ddx39ab
-0.051
csrp1b
0.086
rps12
-0.051
zgc:92630
0.085
smarce1
-0.051
tmbim1b
0.085
rpl17
-0.050