Daniocell
cfap97 (ionocytes / mucous-producing)
cilia and flagella associated protein 97
ZFIN
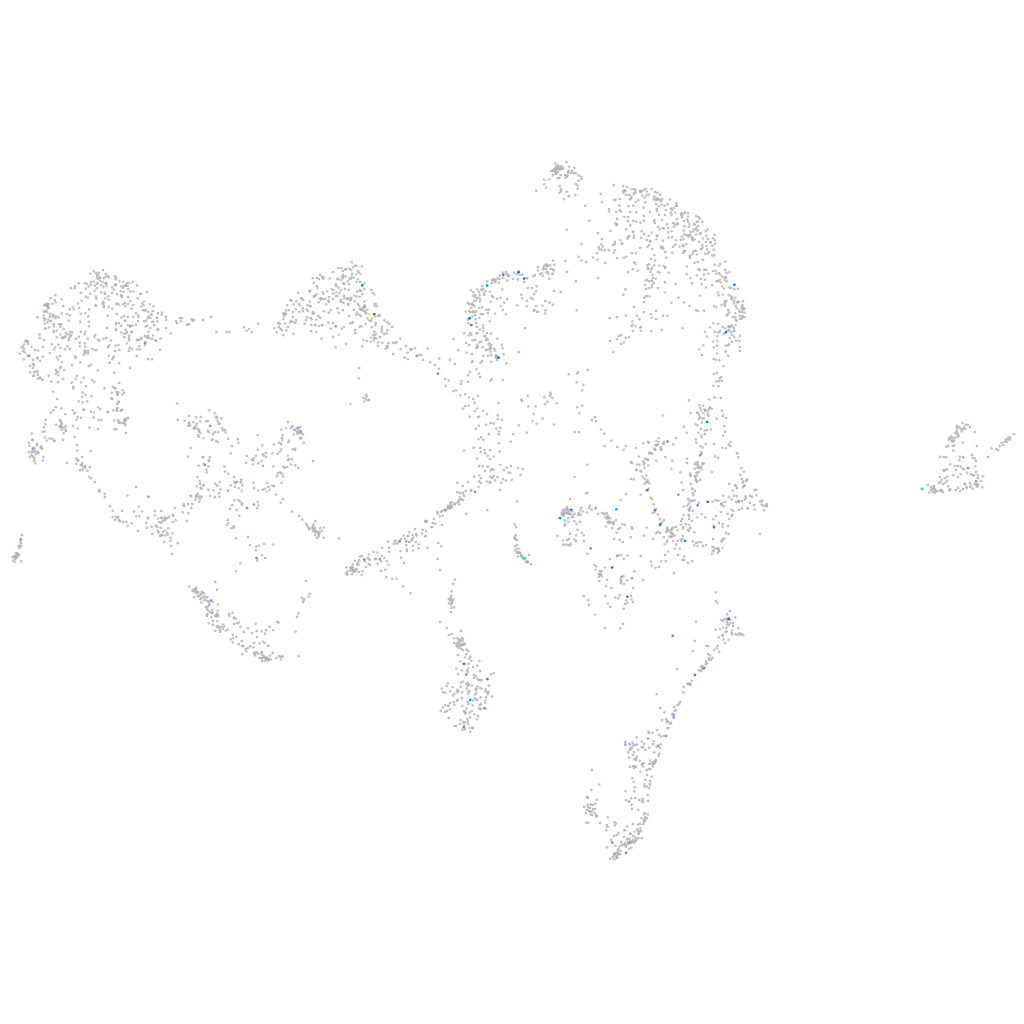
Gene expression UMAP
Display:
Expression
Stage
Other cell groups
all cells
blastomeres
PGCs
endoderm
axial mesoderm
muscle
mural cells /
non-skeletal muscle
mesenchyme
hematopoietic /
vasculature
pronephros
neural
spinal cord / glia
eye
taste / olfactory
otic / lateral line
epidermis
periderm
fin
ionocytes / mucous
pigment cells
Expression by stage/cluster
Correlated gene expression
Positive correlation
Negative correlation
Gene
r
Gene
r
gucy1a1
0.321
aldob
-0.051
LOC110440003
0.309
cxadr
-0.051
zgc:171551
0.302
atp2a3
-0.051
pbrm1
0.302
muc5.1
-0.049
BX927394.1
0.260
si:dkey-65b12.6
-0.049
LOC110439397
0.236
krt5
-0.049
hbl4
0.233
b3gnt7
-0.048
mpp3a
0.223
tmem59
-0.048
hspb7
0.222
zgc:171566
-0.047
si:ch211-236p22.1
0.220
si:dkey-221j11.3
-0.046
ndp
0.218
cd63
-0.046
pcdh2g9
0.218
wu:fa03e10
-0.045
otop2
0.217
wu:fb18f06
-0.045
CABZ01092942.1
0.216
zgc:193505
-0.045
gsg1l2b
0.214
si:dkey-222n6.2
-0.044
ntrk2b
0.206
LOC110438378
-0.044
LOC794549
0.204
tcima
-0.044
mafa
0.202
rplp2
-0.043
epoa
0.202
si:dkey-33i11.9
-0.043
cnbd1
0.202
ckap4
-0.042
cbln4
0.198
c1galt1b
-0.042
rims2a
0.196
lye
-0.042
sobpa
0.193
krtt1c19e
-0.042
fmn2b
0.191
si:ch73-52f15.5
-0.041
fmn2a
0.186
icn
-0.041
LOC110439786
0.182
ch25hl1.1
-0.041
fgf13b
0.181
etnk1
-0.041
FO704648.2
0.180
muc5.2
-0.041
grin2da
0.179
si:ch211-125o16.4
-0.040
LOC103908995
0.174
si:ch211-105c13.3
-0.040
itpr2
0.172
pbxip1b
-0.040
nlgn3a
0.172
myzap
-0.040
kcng3
0.169
tcnbb
-0.040
XLOC-032715
0.168
hrc
-0.039
pcnx4
0.166
pnp5a
-0.039