
"cugbp, Elav-like family member 3a"
ZFIN 
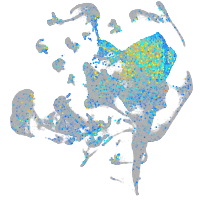
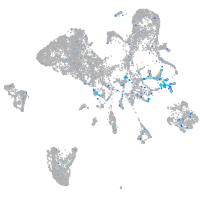
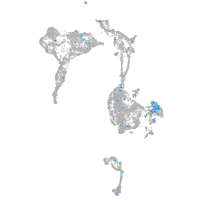
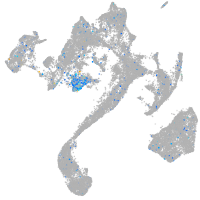
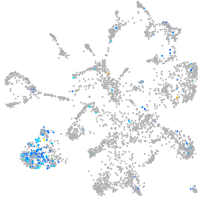
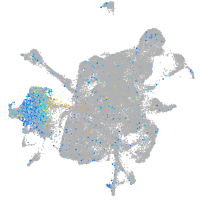
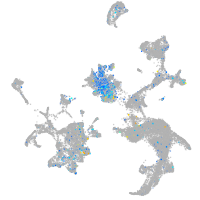
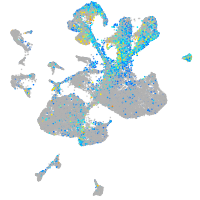
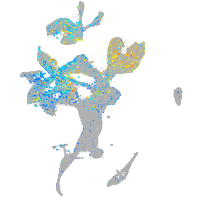
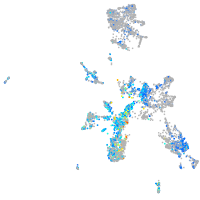
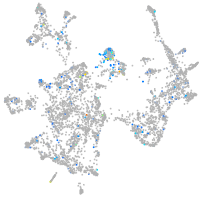
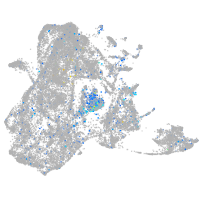
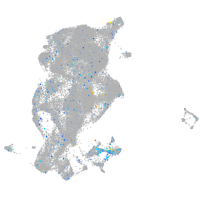
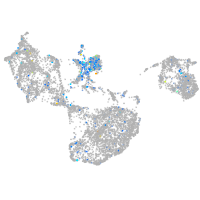
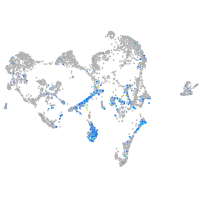
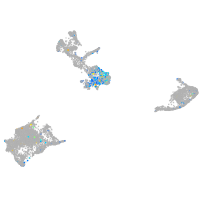
Gene expression UMAP


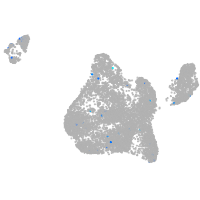
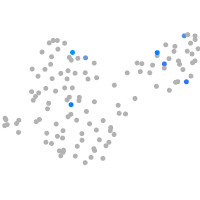
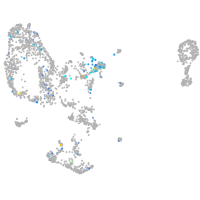
Expression by stage/cluster
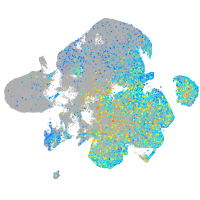
Correlated gene expression
| Positive correlation | Negative correlation | ||
| Gene | r | Gene | r |
| elavl3 | 0.412 | id1 | -0.283 |
| myt1b | 0.398 | mdka | -0.241 |
| rtn1a | 0.329 | XLOC-003690 | -0.237 |
| gng2 | 0.327 | cldn5a | -0.236 |
| stmn1b | 0.324 | vamp3 | -0.211 |
| jagn1a | 0.314 | sdc4 | -0.205 |
| tmsb | 0.313 | hmgb2a | -0.201 |
| LOC100537384 | 0.307 | sparc | -0.200 |
| nsg2 | 0.307 | sox3 | -0.198 |
| ywhah | 0.305 | fosab | -0.193 |
| vamp2 | 0.304 | pcna | -0.192 |
| gng3 | 0.303 | msna | -0.188 |
| zc4h2 | 0.300 | cd82a | -0.187 |
| scrt2 | 0.299 | selenoh | -0.186 |
| stxbp1a | 0.296 | dut | -0.185 |
| myt1a | 0.293 | tuba8l | -0.184 |
| si:dkey-276j7.1 | 0.291 | notch3 | -0.183 |
| tubb5 | 0.291 | COX7A2 (1 of many) | -0.183 |
| sncb | 0.289 | her12 | -0.181 |
| adam22 | 0.288 | msi1 | -0.180 |
| stx1b | 0.286 | atp1a1b | -0.176 |
| golga7ba | 0.282 | sox2 | -0.175 |
| tmeff1b | 0.281 | her2 | -0.173 |
| nhlh2 | 0.278 | pgrmc1 | -0.173 |
| si:dkey-280e21.3 | 0.277 | fabp7a | -0.169 |
| atcaya | 0.270 | si:ch73-281n10.2 | -0.168 |
| epb41a | 0.270 | sox19a | -0.168 |
| stap2a | 0.269 | cd63 | -0.168 |
| hmgb3a | 0.268 | stmn1a | -0.166 |
| zfhx3 | 0.268 | her15.1 | -0.166 |
| insm1a | 0.268 | nutf2l | -0.164 |
| dpysl3 | 0.265 | tuba8l4 | -0.164 |
| rtn1b | 0.262 | gas1b | -0.164 |
| scrt1a | 0.262 | si:ch211-286b5.5 | -0.163 |
| tuba1c | 0.262 | anp32b | -0.162 |