Daniocell
c19h1orf109 (mural cells / non-skeletal muscle)
c19h1orf109 homolog (H. sapiens)
ZFIN
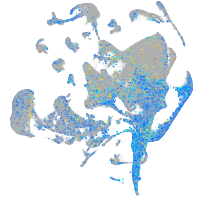
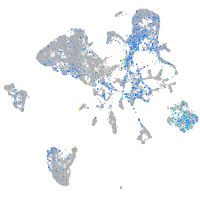
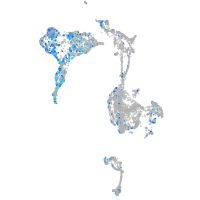
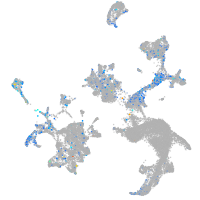
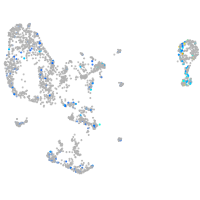
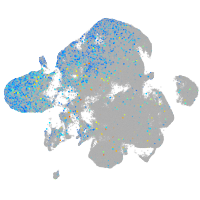
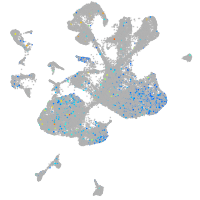
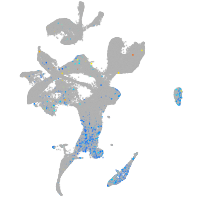
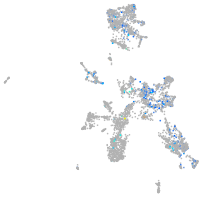
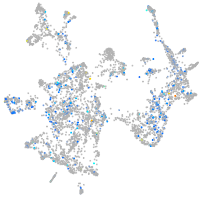
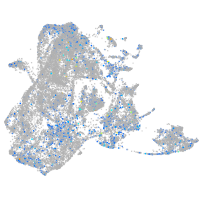
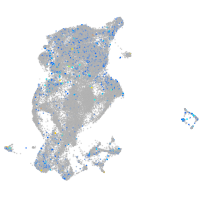
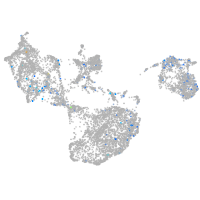
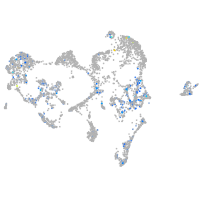
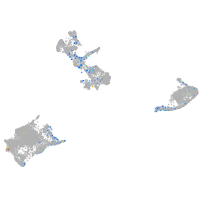
Gene expression UMAP
Display:
Expression
Stage
Other cell groups
all cells
blastomeres
PGCs
endoderm
axial mesoderm
muscle
mural cells /
non-skeletal muscle
mesenchyme
hematopoietic /
vasculature
pronephros
neural
spinal cord / glia
eye
taste / olfactory
otic / lateral line
epidermis
periderm
fin
ionocytes / mucous
pigment cells
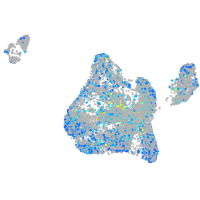
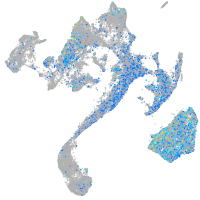
Expression by stage/cluster
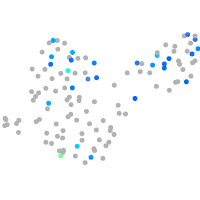
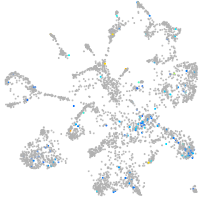
Correlated gene expression
Positive correlation
Negative correlation
Gene
r
Gene
r
bdh2
0.209
tmsb4x
-0.058
b3gnt3.4
0.190
tpm1
-0.051
BX547992.1
0.168
anxa13
-0.049
RF00377
0.149
gabarapa
-0.048
socs4
0.147
ilk
-0.048
gmfg
0.143
hipk3b
-0.047
btr12
0.137
col6a2
-0.047
npm1a
0.132
CR383676.1
-0.046
snu13b
0.130
LOC110439372
-0.045
LOC110439128
0.130
tob1a
-0.045
si:ch1073-153i20.2
0.130
cnn2
-0.045
CU657925.1
0.129
h1f0
-0.044
si:ch211-202p1.5
0.129
marcksl1b
-0.043
CU861459.1
0.127
col6a3
-0.042
psmb9a
0.125
acta1a
-0.041
susd1
0.125
si:ch211-140m22.7
-0.041
pcdh2g5
0.124
stom
-0.040
crygm2d7
0.122
myl9a
-0.040
dkc1
0.119
ppt1
-0.040
nop58
0.115
luzp1
-0.039
pnoca
0.114
ablim1b
-0.039
znf1000
0.114
tln1
-0.039
LOC108183778
0.113
prss35
-0.039
LOC103911098
0.113
cxcl14
-0.039
mlsl
0.112
cacna1c
-0.039
si:dkey-149m13.4
0.112
tagln
-0.038
rrp15
0.110
arl6ip5b
-0.038
irf4b
0.109
wu:fi37e09
-0.038
LOC101885445
0.109
si:dkey-238c7.16
-0.037
si:dkey-239h2.3
0.109
tmem45a
-0.037
masp2
0.108
ccdc32
-0.037
b4galnt3b
0.108
pmp22b
-0.037
bysl
0.107
NC-002333.17
-0.037
CU459089.1
0.106
slc38a10
-0.037
ranbp1
0.106
BX322618.1
-0.036