Daniocell
blm (blastomeres)
BLM RecQ like helicase
ZFIN
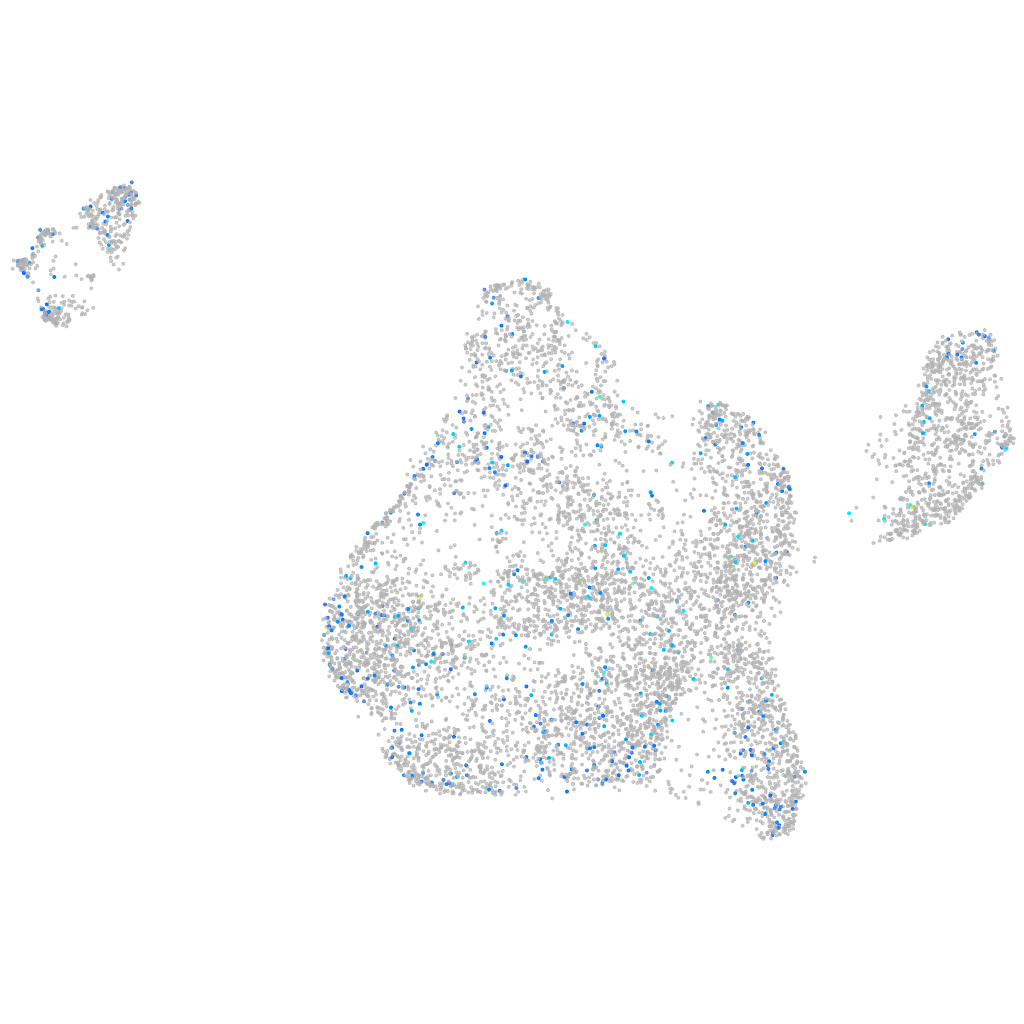
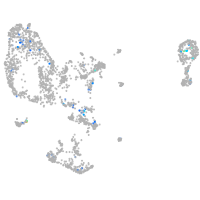
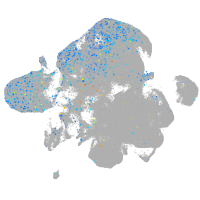
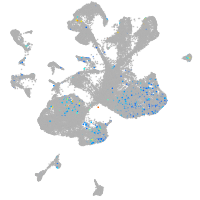
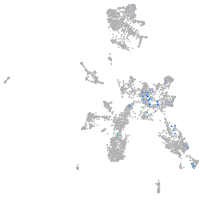
Gene expression UMAP
Display:
Expression
Stage
Other cell groups
all cells
blastomeres
PGCs
endoderm
axial mesoderm
muscle
mural cells /
non-skeletal muscle
mesenchyme
hematopoietic /
vasculature
pronephros
neural
spinal cord / glia
eye
taste / olfactory
otic / lateral line
epidermis
periderm
fin
ionocytes / mucous
pigment cells
Expression by stage/cluster
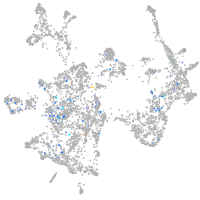
Correlated gene expression
Positive correlation
Negative correlation
Gene
r
Gene
r
BX548044.7
0.074
NC-002333.4
-0.049
CR788316.4
0.072
phyhd1
-0.042
npas4a
0.071
vgll4l
-0.032
LOC101883911
0.069
fopnl
-0.029
CABZ01111959.1
0.066
fgf17
-0.028
mep1a.1
0.065
BX511129.1
-0.028
XLOC-044048
0.065
tsc22d3
-0.028
si:ch1073-220m6.1
0.064
atp2c1
-0.028
lgals9l5
0.064
noto
-0.027
itm2ca
0.063
lgi1a
-0.027
si:dkey-228d14.5
0.062
XLOC-033809
-0.027
LOC110439573
0.062
zgc:173720
-0.027
im:7151449
0.062
coro1cb
-0.026
si:ch211-286b4.4
0.061
rbm7
-0.025
hyal2a
0.060
rhot2
-0.025
LOC108183843
0.060
llgl2
-0.024
XLOC-010289
0.060
micu2
-0.024
si:ch73-309g22.1
0.060
ifngr2
-0.024
BX284635.1
0.059
ppil2
-0.024
si:ch211-232d10.3
0.058
vti1b
-0.023
LOC110439997
0.058
plp2
-0.023
spink4
0.058
zgc:173517
-0.023
dzip1l
0.058
LOC103908923
-0.023
XLOC-021866
0.058
nae1
-0.023
si:ch211-256e16.4
0.058
fkbp7
-0.023
LOC103909950
0.058
fggy
-0.023
lpar5b
0.057
rpl18
-0.023
CR383680.3
0.057
LOC110437782
-0.023
tnni1b
0.056
pdxka
-0.023
LOC101886835
0.055
mrps11
-0.023
BX511079.2
0.055
il1rapl1a
-0.022
LOC103910903
0.055
apoda.2
-0.022
cntnap5a
0.054
wwp1
-0.022
meox1
0.054
sdhdb
-0.022
CR847983.1
0.054
rhoac
-0.022