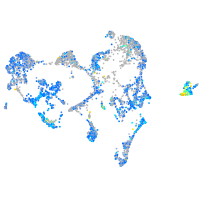
ATPase Na+/K+ transporting subunit beta 1a
ZFIN 
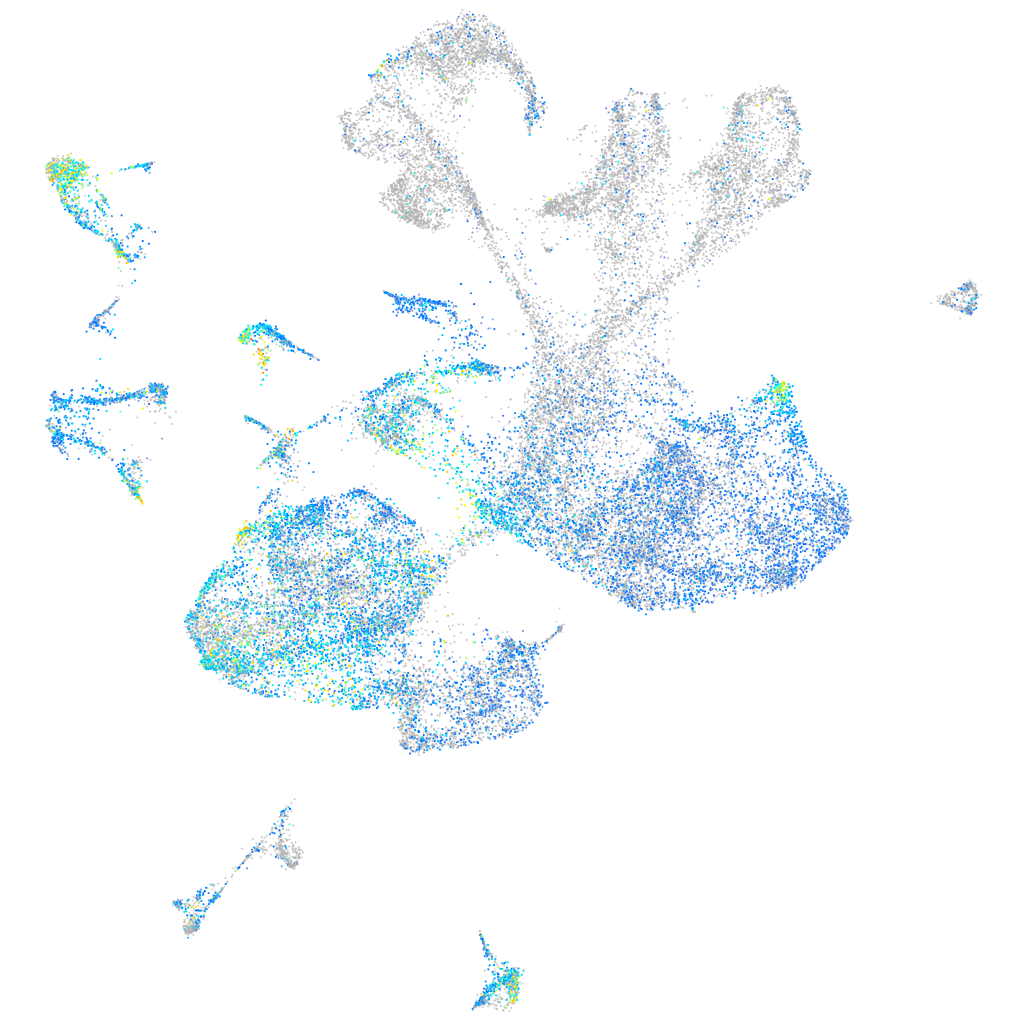
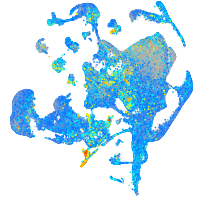
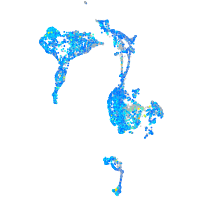
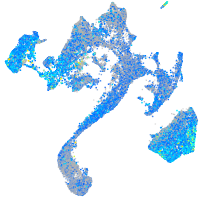
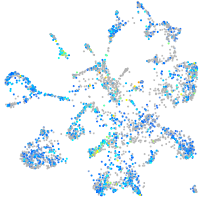
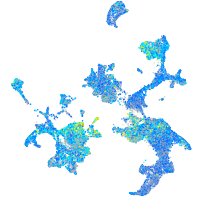
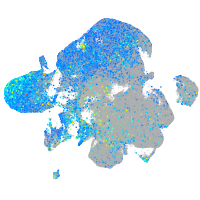
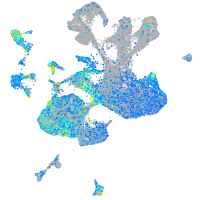
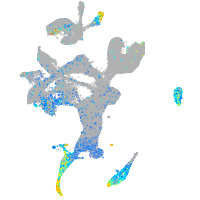
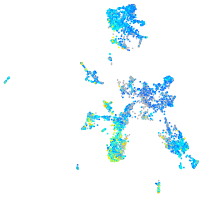
Expression by stage/cluster


Correlated gene expression


| Positive correlation | Negative correlation | ||
| Gene | r | Gene | r |
| qki2 | 0.346 | elavl3 | -0.338 |
| fabp7a | 0.320 | myt1b | -0.296 |
| sparc | 0.313 | ptmab | -0.270 |
| rpz5 | 0.284 | tubb2b | -0.255 |
| efhd1 | 0.281 | h3f3d | -0.249 |
| atp1a1b | 0.280 | hmgb3a | -0.235 |
| cd63 | 0.275 | si:ch211-222l21.1 | -0.235 |
| npc2 | 0.268 | gng2 | -0.228 |
| hepacama | 0.267 | stxbp1a | -0.226 |
| jun | 0.262 | tmsb | -0.221 |
| fosab | 0.261 | zc4h2 | -0.220 |
| id1 | 0.259 | gng3 | -0.219 |
| si:ch1073-303k11.2 | 0.257 | si:dkey-276j7.1 | -0.219 |
| si:ch211-66e2.5 | 0.257 | rtn1a | -0.219 |
| ppap2d | 0.255 | stx1b | -0.218 |
| itm2ba | 0.254 | tubb5 | -0.218 |
| pgrmc1 | 0.251 | sncb | -0.216 |
| klf6a | 0.250 | hnrnpaba | -0.215 |
| metrnla | 0.249 | myt1a | -0.215 |
| atp1b4 | 0.245 | elavl4 | -0.215 |
| cnn2 | 0.241 | si:ch73-386h18.1 | -0.214 |
| socs3a | 0.239 | LOC100537384 | -0.214 |
| si:dkey-7j14.6 | 0.239 | si:ch73-1a9.3 | -0.211 |
| phlda2 | 0.238 | jagn1a | -0.210 |
| cd82a | 0.232 | stmn1b | -0.209 |
| anxa11b | 0.232 | zfhx3 | -0.208 |
| vamp3 | 0.232 | epb41a | -0.207 |
| slc1a3b | 0.232 | syt2a | -0.205 |
| sept10 | 0.230 | snap25a | -0.204 |
| cx43 | 0.230 | onecut1 | -0.204 |
| igfbp7 | 0.229 | h3f3a | -0.204 |
| anxa13 | 0.228 | scrt2 | -0.204 |
| si:ch211-286b5.5 | 0.228 | nsg2 | -0.203 |
| GCA | 0.225 | tmeff1b | -0.199 |
| sox2 | 0.224 | cplx2 | -0.197 |


