Daniocell
ankrd10b (blastomeres)
ankyrin repeat domain 10b
ZFIN
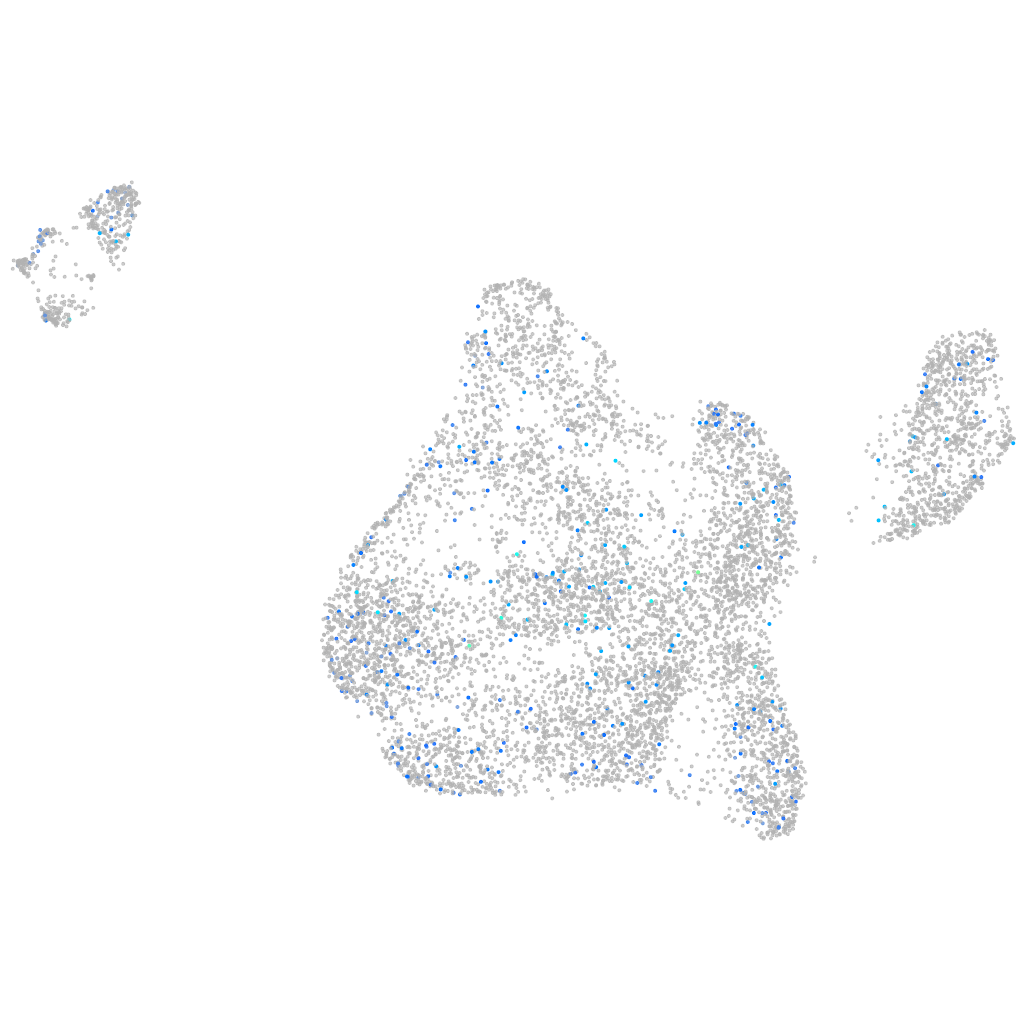
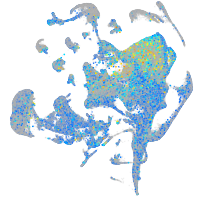
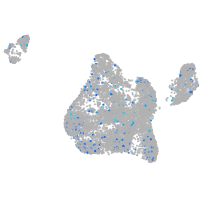
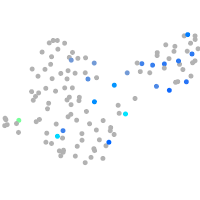
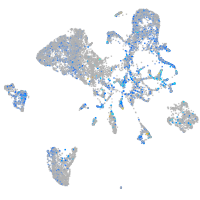
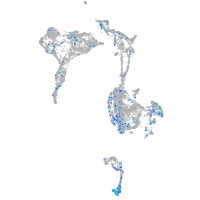
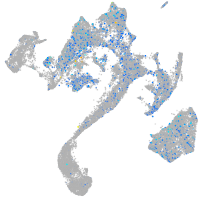
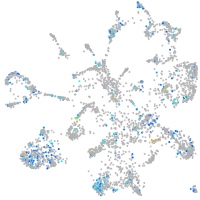
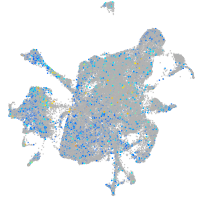
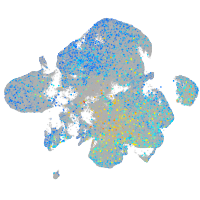
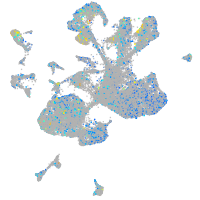
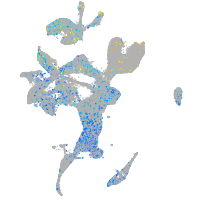
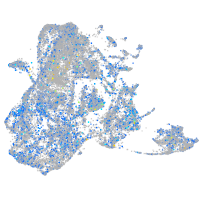
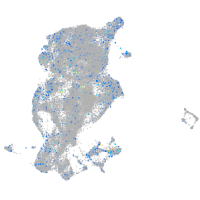
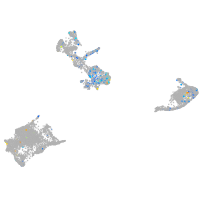
Gene expression UMAP
Display:
Expression
Stage
Other cell groups
all cells
blastomeres
PGCs
endoderm
axial mesoderm
muscle
mural cells /
non-skeletal muscle
mesenchyme
hematopoietic /
vasculature
pronephros
neural
spinal cord / glia
eye
taste / olfactory
otic / lateral line
epidermis
periderm
fin
ionocytes / mucous
pigment cells
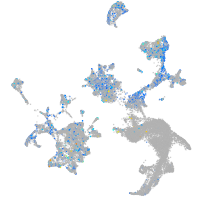
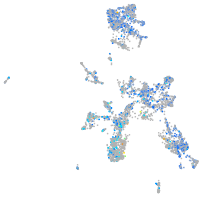
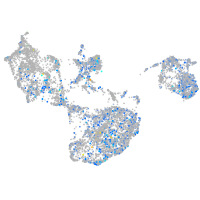
Expression by stage/cluster
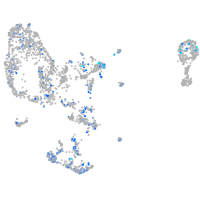
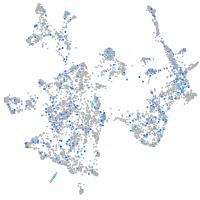
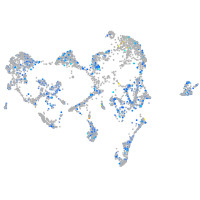
Correlated gene expression
Positive correlation
Negative correlation
Gene
r
Gene
r
cilp2
0.106
NC-002333.4
-0.051
arxb
0.105
taf5l
-0.028
LOC101882926
0.104
mylk5
-0.027
LOC100537813
0.097
tbx16
-0.027
BX927081.1
0.094
xbp1
-0.027
BX294177.1
0.094
im:7145024
-0.026
CR450687.1
0.091
znf1041
-0.026
cers1
0.090
prickle1a
-0.026
faimb
0.090
gmppb
-0.025
FP102171.1
0.089
LOC100537265
-0.025
si:dkeyp-4c4.2
0.085
lft2
-0.025
BX901883.4
0.084
sebox
-0.025
fam20ca
0.080
si:dkey-261j4.5
-0.025
BX469908.1
0.079
klhl13
-0.025
zgc:174153
0.079
mapre2
-0.024
RF00342
0.075
paqr3a
-0.024
CABZ01034596.1
0.074
BX927164.1
-0.024
lrrtm4l2
0.073
chrd
-0.024
tmem150c
0.072
tmc6b
-0.024
LOC100330380
0.071
XLOC-029373
-0.024
CR388055.1
0.070
nsd1a
-0.024
si:dkey-238o14.1
0.070
gnas
-0.024
slc24a5
0.070
tprb
-0.024
acsbg1
0.070
ica1
-0.024
plaua
0.070
llgl2
-0.024
zgc:113307
0.069
fgf3
-0.023
si:dkey-27h10.2
0.069
zp3d.1
-0.023
LOC108179593
0.069
ppp1caa
-0.023
LOC108182660
0.069
dhrs11a
-0.023
si:ch1073-335m2.2
0.068
ifi45
-0.023
LOC110440058
0.068
ccnf
-0.023
f11r.2
0.067
gstcd
-0.022
zgc:172339
0.064
triobpb
-0.022
CR847983.1
0.063
dnmt3bb.3
-0.022
CR925728.2
0.063
stmn4
-0.022