Daniocell
als2b (endoderm)
alsin Rho guanine nucleotide exchange factor ALS2 b
ZFIN
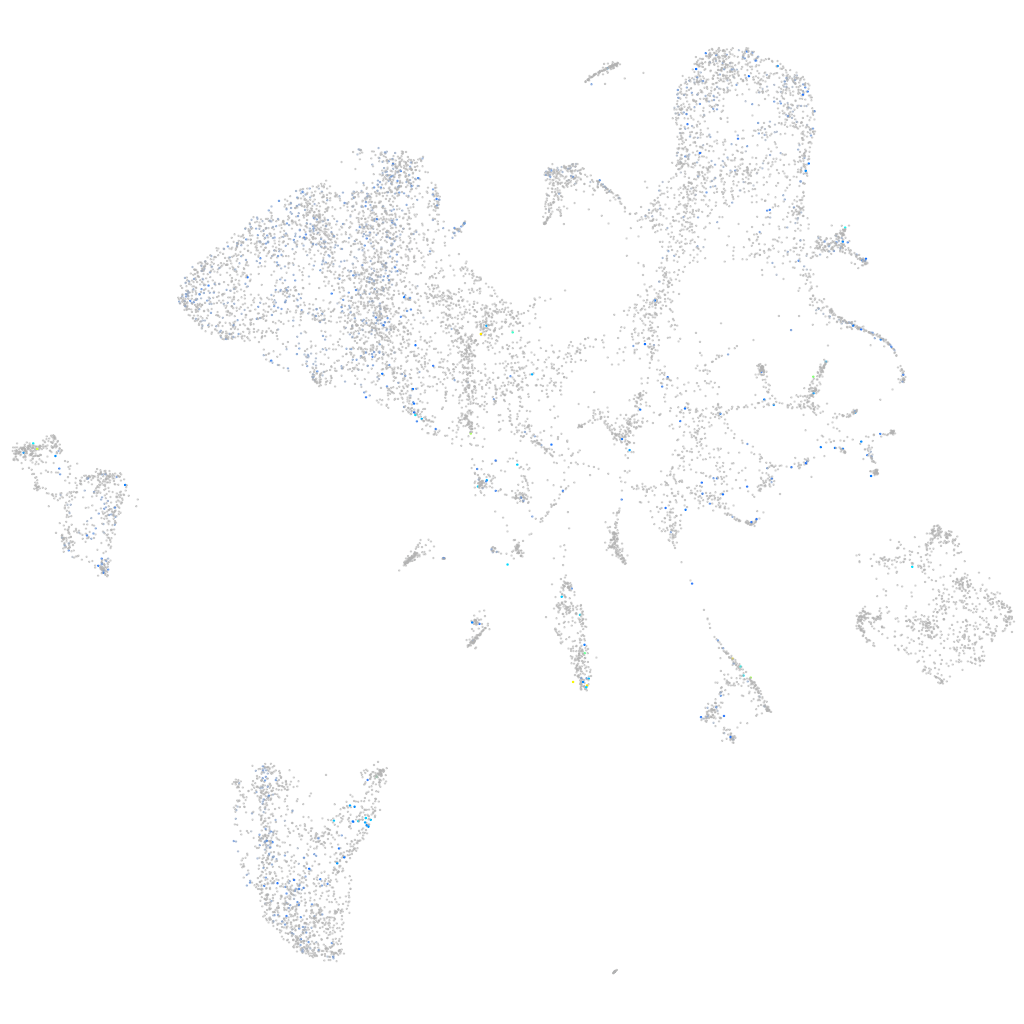
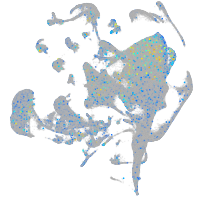
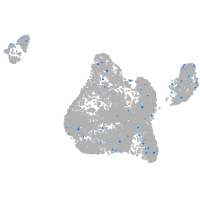
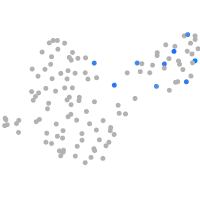
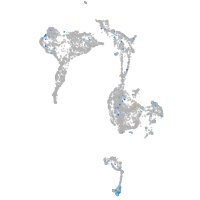
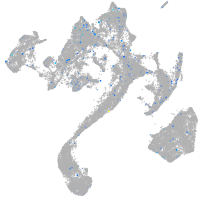
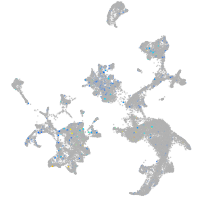
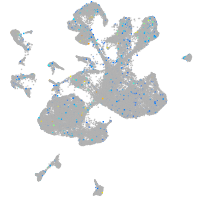
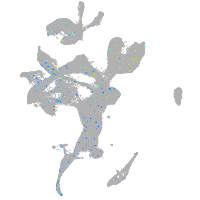
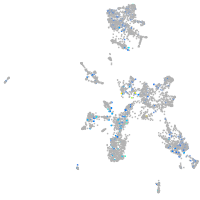
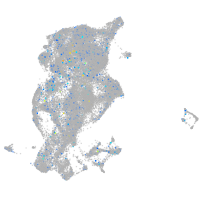
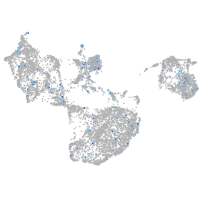
Gene expression UMAP
Display:
Expression
Stage
Other cell groups
all cells
blastomeres
PGCs
endoderm
axial mesoderm
muscle
mural cells /
non-skeletal muscle
mesenchyme
hematopoietic /
vasculature
pronephros
neural
spinal cord / glia
eye
taste / olfactory
otic / lateral line
epidermis
periderm
fin
ionocytes / mucous
pigment cells
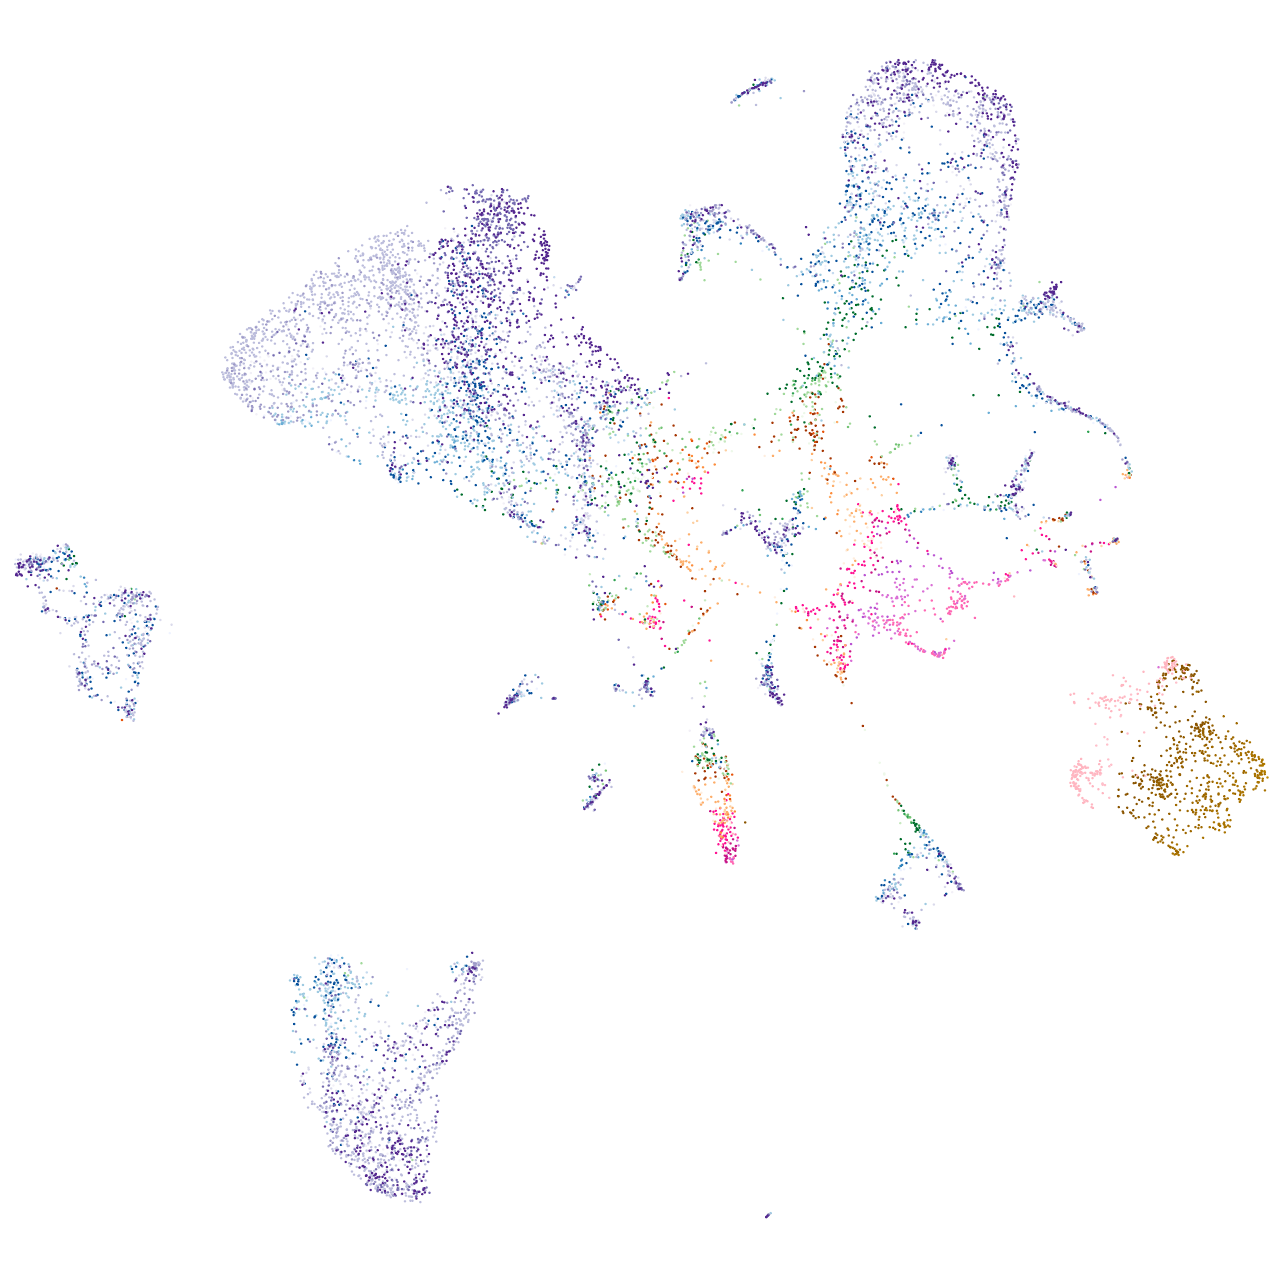
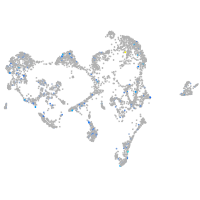
Expression by stage/cluster
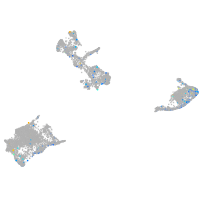
Correlated gene expression
Positive correlation
Negative correlation
Gene
r
Gene
r
LOC101886439
0.160
snu13b
-0.069
vav3b
0.133
nop58
-0.069
kmo
0.126
si:ch211-222l21.1
-0.068
XLOC-039631
0.125
seta
-0.066
LOC103911313
0.120
ranbp1
-0.066
si:dkey-29m1.2
0.119
hnrnpaba
-0.066
METTL21C
0.117
hmgb2a
-0.066
sult1st7
0.114
hnrnpabb
-0.064
LOC110438467
0.107
snrpd3l
-0.064
fhdc4
0.106
cbx1a
-0.064
mov10b.2
0.105
ncl
-0.063
spire2
0.105
pcna
-0.063
LOC101882128
0.105
cbx3a
-0.062
LOC100535200
0.105
u2af1
-0.062
si:ch211-113e8.9
0.102
sub1a
-0.062
pimr169
0.100
magoh
-0.062
zgc:162941
0.098
hmgb2b
-0.062
btr18.1
0.095
npm1a
-0.060
hbl2
0.095
ppig
-0.060
si:ch73-186j5.2
0.093
si:ch73-281n10.2
-0.060
hbba2
0.093
sap18
-0.060
CABZ01087091.1
0.091
marcksl1b
-0.059
phospho1
0.091
snrpd2
-0.059
prkag3b
0.091
eif2s1a
-0.059
dennd2db
0.087
hmga1a
-0.059
si:ch73-379j16.2
0.086
snrpc
-0.059
LOC103909610
0.086
nasp
-0.059
slc25a1b
0.085
ddx39ab
-0.058
hdlbpa
0.085
setb
-0.058
LOC101886114
0.084
nucks1b
-0.058
pcdh1g13
0.083
lig1
-0.058
cobll1b
0.082
tma7
-0.058
abat
0.081
nucks1a
-0.058
mt-nd4
0.080
si:ch73-308l14.2
-0.058
renbp
0.080
dkc1
-0.057