Daniocell
zp3 (glial cells / spinal cord)
zona pellucida glycoprotein 3
ZFIN
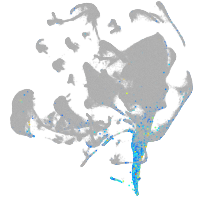
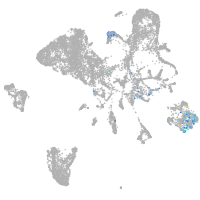
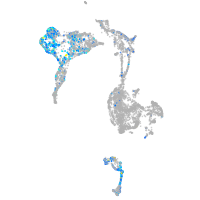
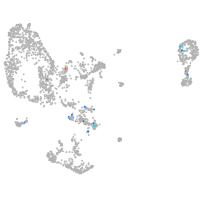
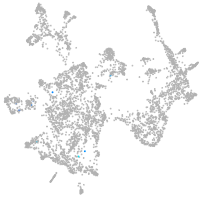
Gene expression UMAP
Display:
Expression
Stage
Other cell groups
all cells
blastomeres
PGCs
endoderm
axial mesoderm
muscle
mural cells /
non-skeletal muscle
mesenchyme
hematopoietic /
vasculature
pronephros
neural
spinal cord / glia
eye
taste / olfactory
otic / lateral line
epidermis
periderm
fin
ionocytes / mucous
pigment cells
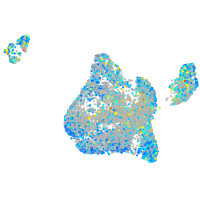
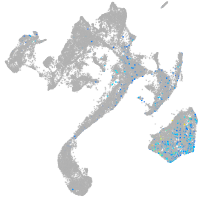
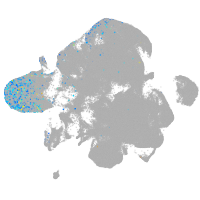
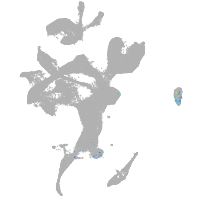
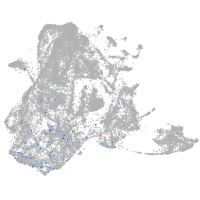
Expression by stage/cluster
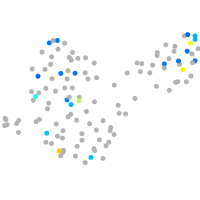
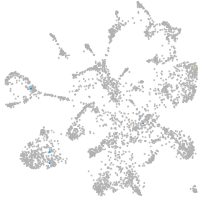
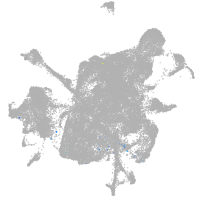
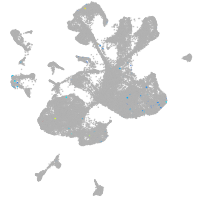
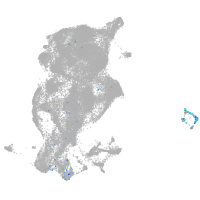
Correlated gene expression
Positive correlation
Negative correlation
Gene
r
Gene
r
CABZ01051877.1
0.172
gpm6aa
-0.037
AL772219.1
0.096
ckbb
-0.036
apela
0.087
pvalb2
-0.035
BX927258.1
0.086
pvalb1
-0.035
hspb1
0.082
actc1b
-0.033
fndc7rs3
0.079
rtn1a
-0.032
LOC103911809
0.076
hbae3
-0.032
bcl10
0.074
COX3
-0.032
FP085399.5
0.074
gpm6ab
-0.030
XLOC-032526
0.068
hmgb1a
-0.029
cdx4
0.065
tmsb
-0.028
XLOC-028454
0.064
stmn1b
-0.028
XLOC-039121
0.064
hbbe1.3
-0.028
BX936305.2
0.061
fabp7a
-0.028
fgf23
0.059
marcksl1b
-0.027
asb11
0.059
mylpfa
-0.027
npm1a
0.058
hbae1.1
-0.026
CABZ01053592.1
0.058
elavl3
-0.026
ft2
0.055
CR383676.1
-0.026
BX005421.3
0.055
gng3
-0.026
si:dkeyp-77c4.1
0.055
vamp2
-0.026
odc1
0.053
ndrg2
-0.025
si:ch211-277c7.7
0.052
elavl4
-0.025
XLOC-001964
0.052
rnasekb
-0.025
nop10
0.052
CU467822.1
-0.025
CU463231.2
0.052
kdm6bb
-0.025
ftr69
0.052
tnrc6c1
-0.025
LOC103911774
0.051
myt1b
-0.025
ankrd52b
0.051
calm1a
-0.024
dkc1
0.051
si:ch211-260e23.9
-0.024
XLOC-001603
0.051
cplx2
-0.024
nradd
0.051
si:dkeyp-75h12.5
-0.024
ACOT12
0.051
nsg2
-0.024
si:ch211-132b12.1
0.050
fez1
-0.023
si:ch211-156l18.6
0.050
syt11a
-0.023