Daniocell
zgc:55733 (taste / olfactory)
zgc:55733
ZFIN
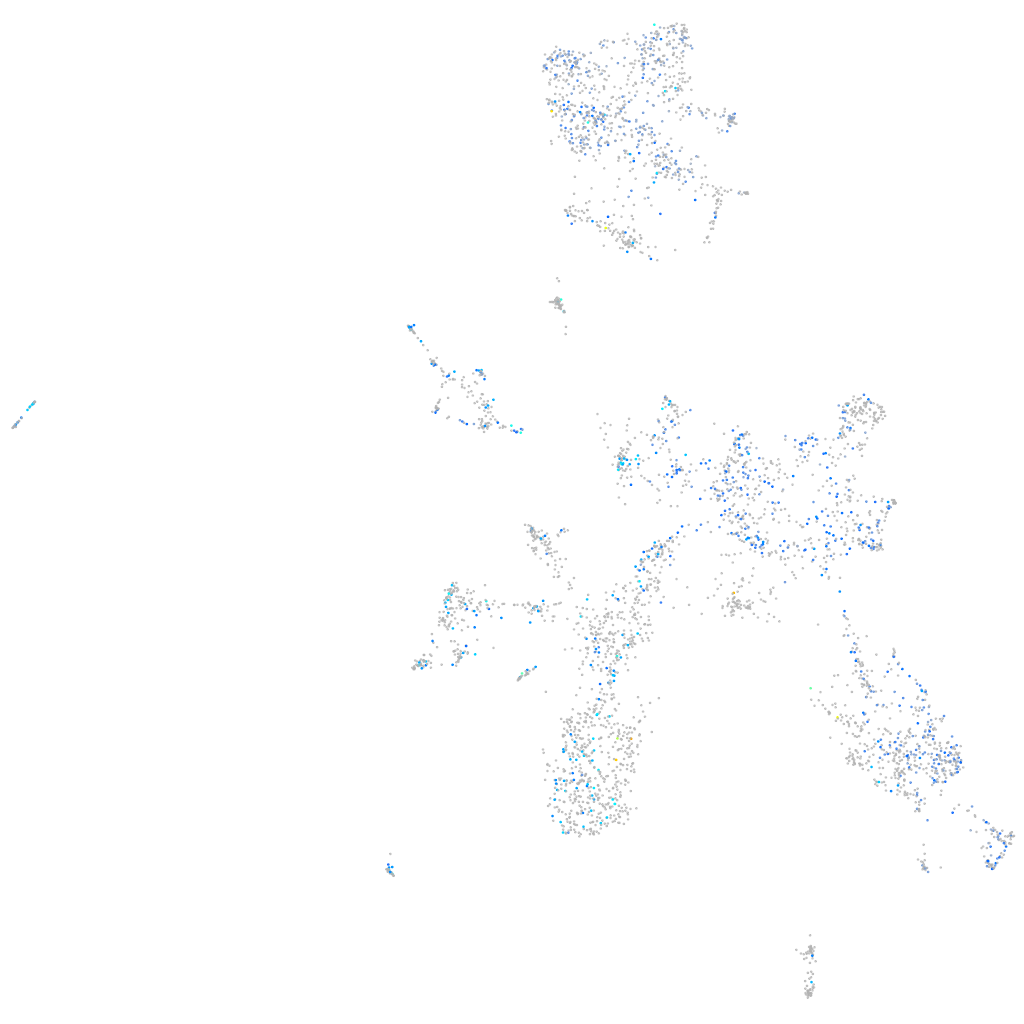
Gene expression UMAP
Display:
Expression
Stage
Other cell groups
all cells
blastomeres
PGCs
endoderm
axial mesoderm
muscle
mural cells /
non-skeletal muscle
mesenchyme
hematopoietic /
vasculature
pronephros
neural
spinal cord / glia
eye
taste / olfactory
otic / lateral line
epidermis
periderm
fin
ionocytes / mucous
pigment cells
Expression by stage/cluster
Correlated gene expression
Positive correlation
Negative correlation
Gene
r
Gene
r
LOC101885283
0.113
icn
-0.059
slc35g2a
0.107
rplp2
-0.056
pou3f1
0.107
wu:fb18f06
-0.055
tmem68
0.105
si:dkey-151g10.6
-0.054
spi1b
0.102
icn2
-0.052
LOC108182317
0.102
tmsb1
-0.052
XLOC-039630
0.097
rpl36
-0.049
znf1134
0.094
rps28
-0.047
LOC101882866
0.093
rps29
-0.046
rcvrn2
0.091
hbae1.1
-0.046
eif4a3
0.091
ttc8
-0.046
si:ch211-288g17.3
0.091
abca1b
-0.045
CABZ01084564.1
0.091
rpl29
-0.044
gfra2b
0.090
afdna
-0.044
cdc20
0.089
anxa1a
-0.044
gch1
0.089
anxa2a
-0.044
ppp3r1b
0.089
abcd3a
-0.044
VSTM2A
0.088
pank1b
-0.043
LOC110439128
0.088
hsd17b14
-0.043
pcdh1g30
0.088
trim2b
-0.042
b3glcta
0.088
BX569793.1
-0.042
si:dkey-217f16.5
0.087
krt94
-0.041
rab2a
0.087
krt4
-0.041
tspan7
0.086
si:ch211-86h15.1
-0.041
muc5.2
0.085
cxl34b.11
-0.041
pnrc1
0.085
CR786562.1
-0.040
zgc:114120
0.085
zgc:193505
-0.040
si:dkey-4c15.14
0.084
zgc:153284
-0.040
XLOC-032543
0.084
txn
-0.040
setb
0.084
krt91
-0.040
LOC110438242
0.084
aqp3a
-0.040
kcnip1b
0.084
si:ch211-105c13.3
-0.040
ptprn2
0.084
mfge8b
-0.040
BX629344.1
0.084
degs2
-0.040
gyg1a
0.084
elavl4
-0.040