Daniocell
zgc:173577 (mesenchyme)
zgc:173577
ZFIN
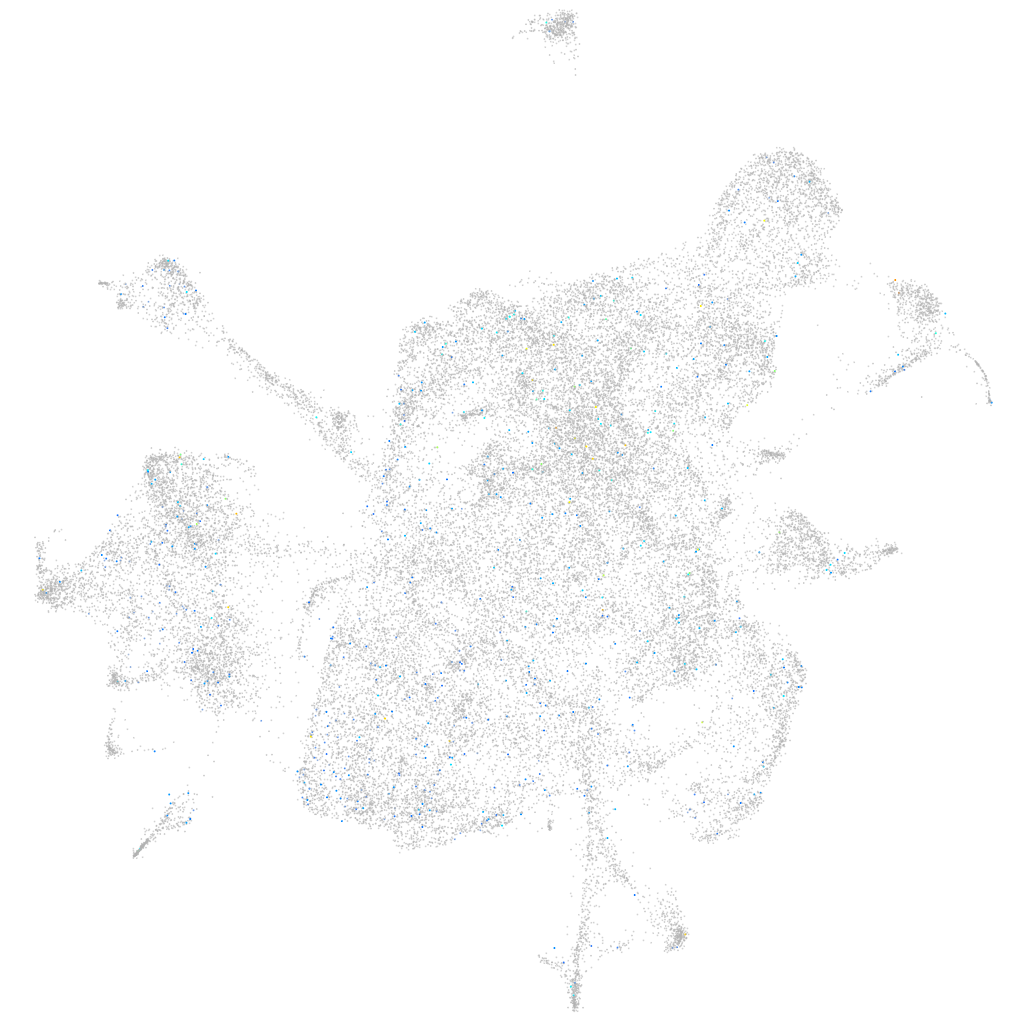
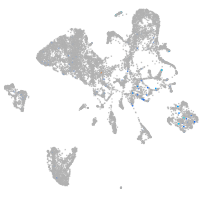
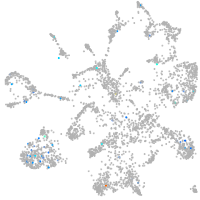
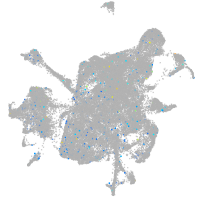
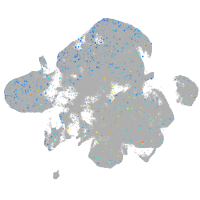
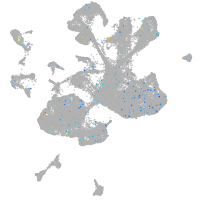
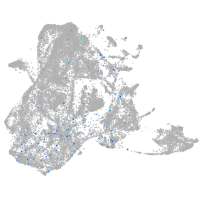
Gene expression UMAP
Display:
Expression
Stage
Other cell groups
all cells
blastomeres
PGCs
endoderm
axial mesoderm
muscle
mural cells /
non-skeletal muscle
mesenchyme
hematopoietic /
vasculature
pronephros
neural
spinal cord / glia
eye
taste / olfactory
otic / lateral line
epidermis
periderm
fin
ionocytes / mucous
pigment cells
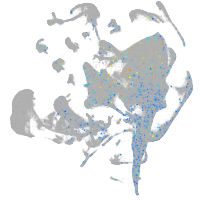
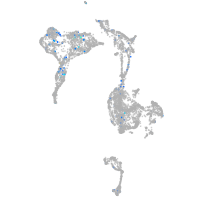
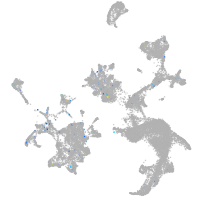
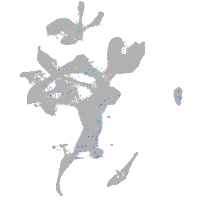
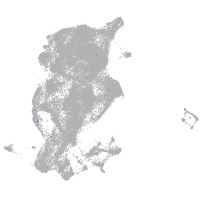
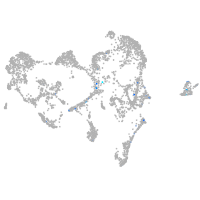
Expression by stage/cluster
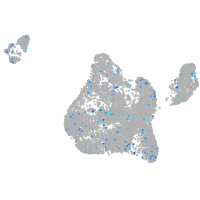
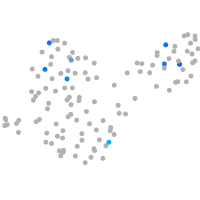
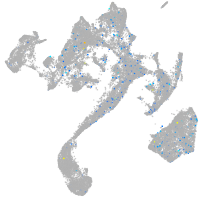
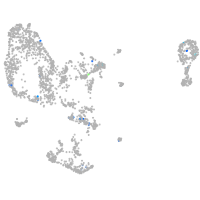
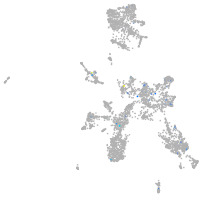
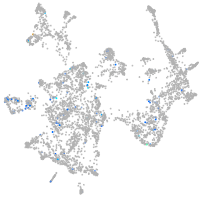
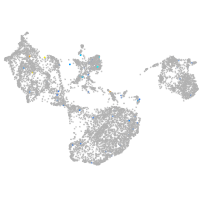
Correlated gene expression
Positive correlation
Negative correlation
Gene
r
Gene
r
LOC110438127
0.057
rpl29
-0.017
LO018324.1
0.055
pabpc1b
-0.016
si:dkey-163f12.6
0.055
mt-atp8
-0.014
CR383669.7
0.054
myhz2
-0.014
CABZ01060491.1
0.052
nfkbiaa
-0.013
LOC100536800
0.050
sfrp1b
-0.013
LOC100334677
0.048
snorc
-0.013
FP016142.2
0.048
limch1b
-0.013
opn1mw3
0.047
rps28
-0.013
CR556712.1
0.046
loxl2a
-0.013
CR450780.3
0.046
rpl36
-0.013
zgc:195356
0.046
cavin2b
-0.013
zgc:194686
0.045
tnn
-0.013
XLOC-040517
0.044
peak1
-0.013
CU468917.1
0.042
gale
-0.013
LOC108191704
0.042
col11a2
-0.012
slc1a2a
0.042
col11a1a
-0.012
LO018493.1
0.042
xylt1
-0.012
LOC108182577
0.041
col9a1a
-0.012
enpp7.2
0.041
sypl2a
-0.012
LOC108191752
0.041
nog3
-0.012
GPR45
0.041
pcolce2b
-0.012
si:dkey-183c6.7
0.041
col2a1a
-0.012
adgrf8
0.040
zgc:162879
-0.012
socs1b
0.039
matn1
-0.012
olfch1
0.038
papss2b
-0.011
LOC110438308.1
0.038
cnmd
-0.011
CU179758.1
0.038
CYTL1
-0.011
zgc:100997
0.038
rps29
-0.011
zgc:136872
0.038
CABZ01050249.1
-0.011
cacng1b
0.038
hbbe1.1
-0.011
LOC108180725
0.037
ptgdsa
-0.011
CABZ01079192.1
0.036
ppfibp2a
-0.011
XLOC-043097
0.035
sema3fb
-0.011
zgc:153913
0.035
CU929259.1
-0.011