Daniocell
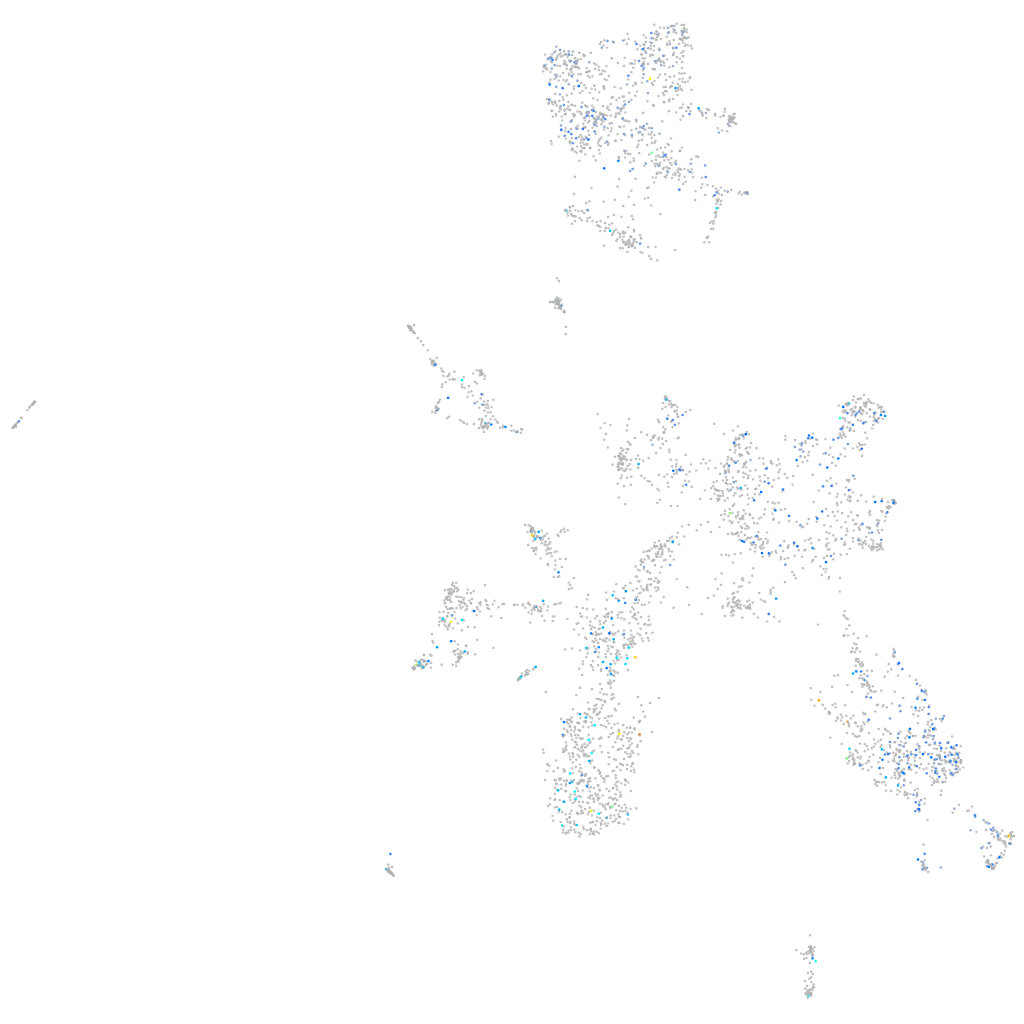
zgc:136439 (taste / olfactory)
zgc:136439
ZFIN
Gene expression UMAP
Display:
Expression
Stage
Other cell groups
all cells
blastomeres
PGCs
endoderm
axial mesoderm
muscle
mural cells /
non-skeletal muscle
mesenchyme
hematopoietic /
vasculature
pronephros
neural
spinal cord / glia
eye
taste / olfactory
otic / lateral line
epidermis
periderm
fin
ionocytes / mucous
pigment cells
Expression by stage/cluster
Correlated gene expression
Positive correlation
Negative correlation
Gene
r
Gene
r
CU929203.2
0.151
CU467822.1
-0.050
si:ch211-264f5.8
0.137
meaf6
-0.050
si:ch73-170d6.4
0.136
neurod1
-0.046
LOC100330861
0.125
uba2
-0.045
XLOC-004189
0.121
sox4a
-0.045
XLOC-016165
0.120
hdac1
-0.043
si:ch211-244e12.7
0.113
cdc25b
-0.043
LOC101885945
0.112
dla
-0.042
LOC103910403
0.112
tox
-0.042
ftr80
0.110
faua
-0.042
BX294444.1
0.109
her13
-0.041
LOC110437938
0.109
notch1a
-0.041
LOC101886926
0.108
inavaa
-0.041
LOC103910166
0.107
si:dkey-56m19.5
-0.041
crygm2d8
0.105
XLOC-000431
-0.041
zgc:174354
0.104
nudt5
-0.040
si:dkeyp-35e5.5
0.102
h2afva
-0.040
si:ch211-244a23.1
0.101
bcam
-0.040
LOC108182916
0.101
mex3b
-0.040
galnt18a
0.099
khsrp
-0.039
ttc41
0.097
gadd45gb.1
-0.039
lhpp
0.097
rps25
-0.039
xylt1
0.097
marcksl1a
-0.039
rad23ab
0.097
ywhag2
-0.038
RF00151
0.097
acta1b
-0.038
uts2a
0.096
rps12
-0.038
CR792422.2
0.095
ypel1
-0.038
CR384099.1
0.094
kansl3
-0.038
rpp25b
0.094
tmpob
-0.038
CU694317.1
0.093
cited4b
-0.037
prokr1b
0.093
srsf3a
-0.037
XLOC-031115
0.092
mir181b-3
-0.037
zgc:194242
0.092
cnppd1
-0.037
AL845428.1
0.092
nme2b.2
-0.037
btbd16
0.090
sall4
-0.037