Daniocell
yrdc (pigment cells)
yrdC N(6)-threonylcarbamoyltransferase domain containing
ZFIN
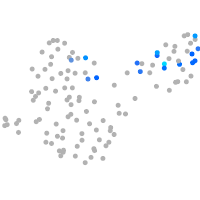
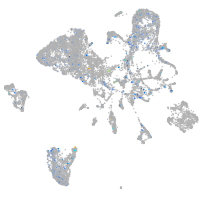
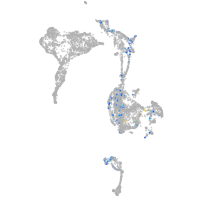
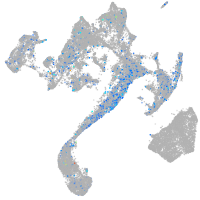
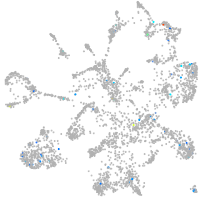
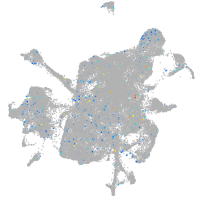
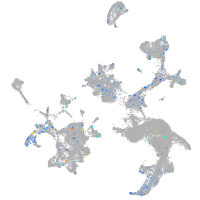
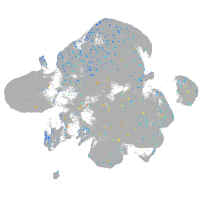
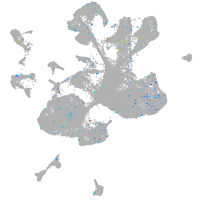
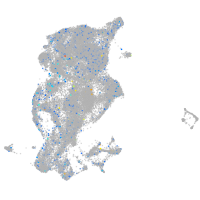
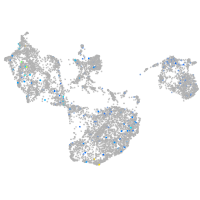
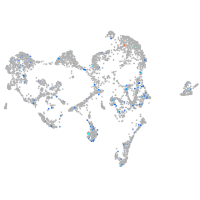
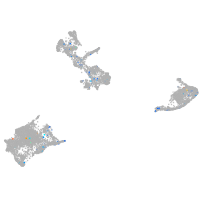
Gene expression UMAP
Display:
Expression
Stage
Other cell groups
all cells
blastomeres
PGCs
endoderm
axial mesoderm
muscle
mural cells /
non-skeletal muscle
mesenchyme
hematopoietic /
vasculature
pronephros
neural
spinal cord / glia
eye
taste / olfactory
otic / lateral line
epidermis
periderm
fin
ionocytes / mucous
pigment cells
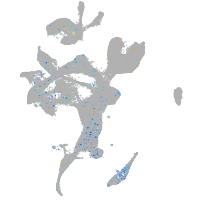
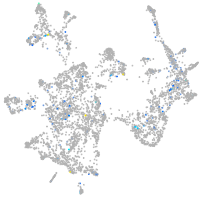
Expression by stage/cluster
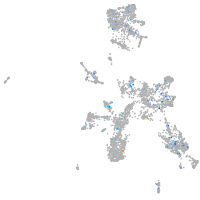
Correlated gene expression
Positive correlation
Negative correlation
Gene
r
Gene
r
cbln17
0.228
tmsb4x
-0.042
spag8
0.212
si:dkey-251i10.2
-0.038
col5a3b
0.180
gstp1
-0.037
cyp21a2
0.173
uraha
-0.035
tgm1l4
0.150
actc1b
-0.035
ftr02
0.149
gch2
-0.033
anpepb
0.143
tmem130
-0.032
si:dkey-243k1.3
0.137
zgc:110339
-0.032
clec14a
0.135
oacyl
-0.032
si:ch211-231i17.4
0.134
pvalb2
-0.031
zgc:92275
0.133
CABZ01021592.1
-0.030
c1qb
0.126
nme2b.2
-0.030
LOC110440179
0.122
hbae1.1
-0.028
cpne5b
0.118
myhz2
-0.028
CU459094.3
0.113
tnni2a.4
-0.028
FO904898.5
0.110
mdh1aa
-0.027
adamts9
0.104
hbbe1.1
-0.026
XLOC-007364
0.103
slc22a7a
-0.025
sst1.2
0.103
hbbe1.3
-0.024
SAT2
0.102
si:ch211-251b21.1
-0.024
si:dkeyp-7a3.1
0.101
krt4
-0.023
LOC110440078
0.100
krt17
-0.023
LOC110438203
0.100
hbbe1.2
-0.023
cfap73
0.100
ttn.2
-0.022
LOC101886598
0.100
tnnc2
-0.022
ctnnal1
0.099
ctdsp2
-0.022
smtna
0.099
acta1b
-0.022
ARMC6
0.099
palm1a
-0.021
lcmt2
0.097
hbae3
-0.021
adcy2a
0.097
tpma
-0.021
XLOC-013219
0.096
tmsb1
-0.021
ponzr2
0.092
pmp22b
-0.020
scn5lab
0.091
tnfrsf21
-0.020
sst2
0.091
si:ch211-195b11.3
-0.020
aldh3b1
0.091
pvalb1
-0.020