Daniocell
xrn1 (pigment cells)
5'-3' exoribonuclease 1
ZFIN
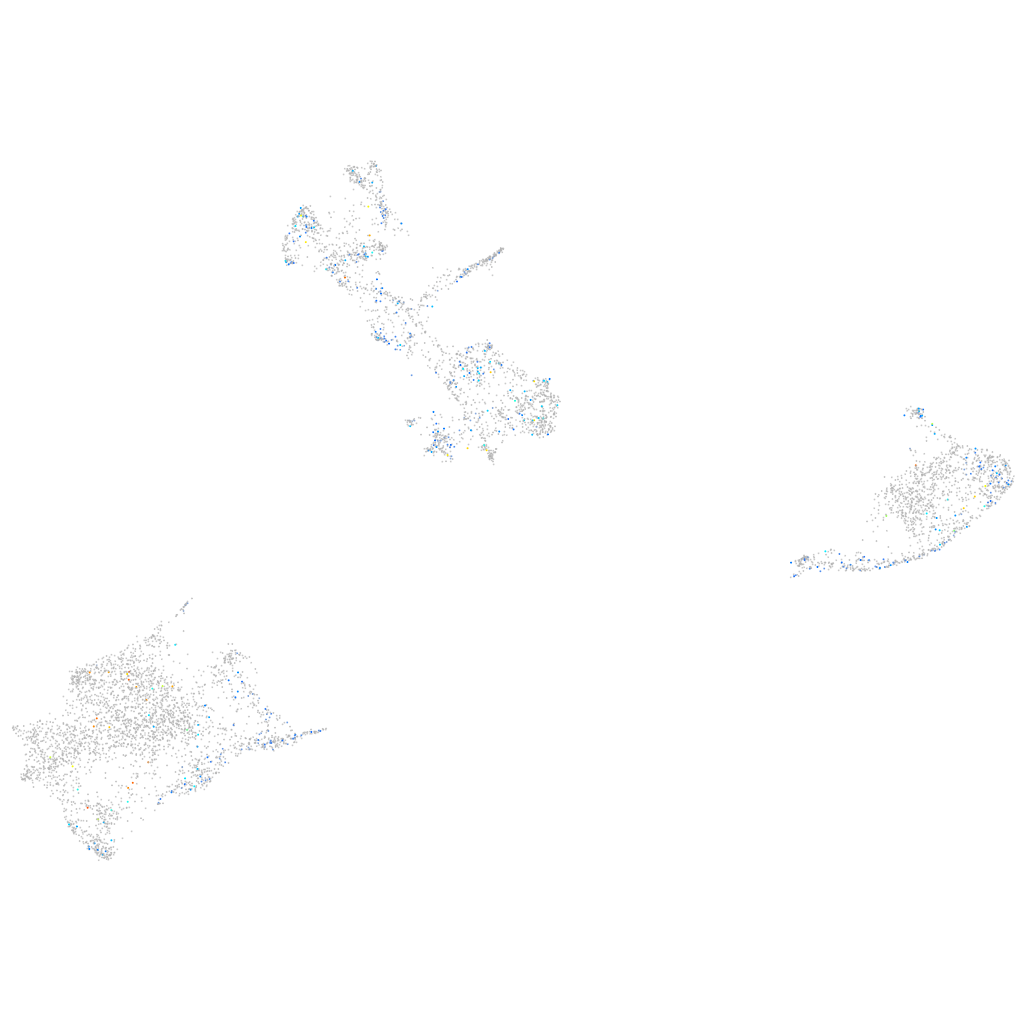
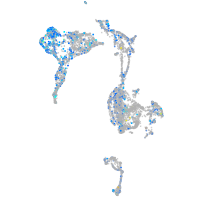
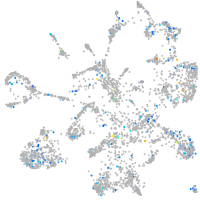
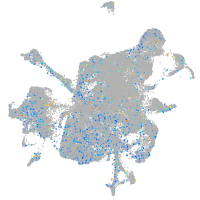
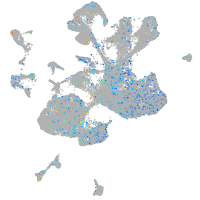
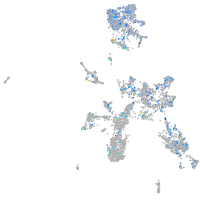
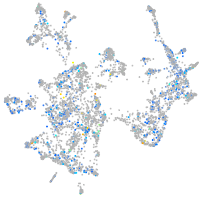
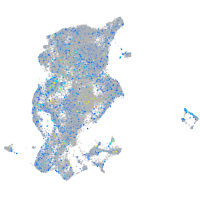
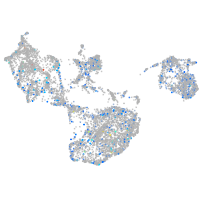
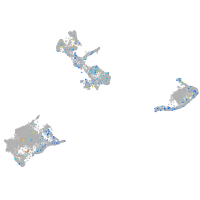
Gene expression UMAP
Display:
Expression
Stage
Other cell groups
all cells
blastomeres
PGCs
endoderm
axial mesoderm
muscle
mural cells /
non-skeletal muscle
mesenchyme
hematopoietic /
vasculature
pronephros
neural
spinal cord / glia
eye
taste / olfactory
otic / lateral line
epidermis
periderm
fin
ionocytes / mucous
pigment cells
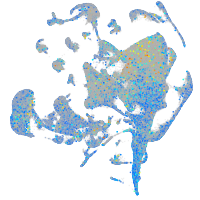
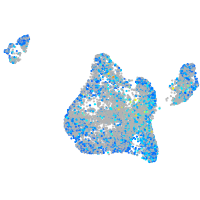
Expression by stage/cluster
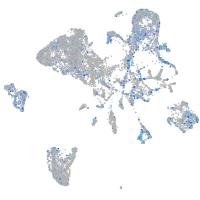
Correlated gene expression
Positive correlation
Negative correlation
Gene
r
Gene
r
vav3b
0.147
gch2
-0.057
RF00067
0.123
si:dkey-251i10.2
-0.057
si:dkeyp-79b7.12
0.109
uraha
-0.054
a1cf
0.109
slc22a7a
-0.051
XLOC-029030
0.108
CABZ01021592.1
-0.049
AL929048.1
0.108
gstp1
-0.044
fam171a2a
0.103
aqp3a
-0.043
glt1d1
0.103
akr1b1
-0.043
BX901883.2
0.102
tmem130
-0.041
XLOC-002533
0.101
zgc:110339
-0.040
LOC100331639
0.100
actb2
-0.040
BX571762.1
0.099
s100a10b
-0.038
CABZ01051901.1
0.099
pts
-0.037
CABZ01081294.1
0.098
si:dkey-126g1.9
-0.036
LOC101882950
0.098
aldob
-0.036
znf987
0.097
rbp4l
-0.035
pimr184
0.092
actc1b
-0.034
CR383676.1
0.091
rtn1b
-0.034
srsf5a
0.088
cyb5a
-0.034
dmap1
0.088
hbae1.1
-0.033
thoc5
0.087
icn
-0.032
akap12b
0.086
gpd1b
-0.032
si:dkey-40c23.1
0.086
ckma
-0.031
CU457778.2
0.084
hbbe2
-0.030
slc10a4
0.083
krt4
-0.030
LOC108179993
0.082
prdx5
-0.029
ackr4a
0.080
acta1b
-0.029
LOC100329795
0.080
pvalb1
-0.029
LOC103908832
0.079
bco1
-0.029
CR457445.1
0.079
lim2.2
-0.028
BX511265.2
0.079
rpl19
-0.027
LOC103909515
0.079
vps26a
-0.026
fgf1b
0.078
tcnbb
-0.026
phyhip
0.078
fbp1a
-0.026
trabd2a
0.078
cmtm3
-0.025