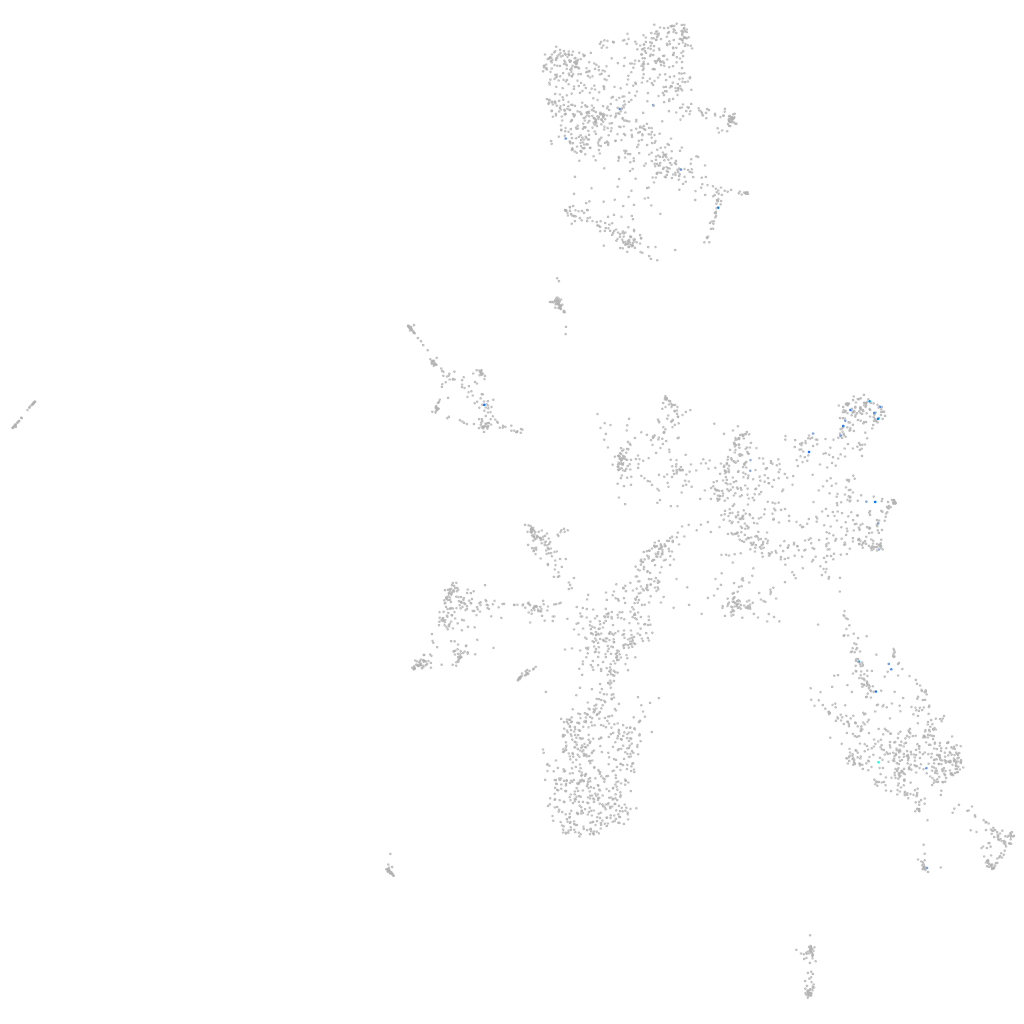
Daniocell
XLOC-041834 (taste / olfactory)
Gene expression UMAP
Display:
Expression
Stage
Other cell groups
all cells
blastomeres
PGCs
endoderm
axial mesoderm
muscle
mural cells /
non-skeletal muscle
mesenchyme
hematopoietic /
vasculature
pronephros
neural
spinal cord / glia
eye
taste / olfactory
otic / lateral line
epidermis
periderm
fin
ionocytes / mucous
pigment cells
Expression by stage/cluster
Correlated gene expression
Positive correlation
Negative correlation
Gene
r
Gene
r
XLOC-002636
0.447
rnasekb
-0.062
XLOC-028954
0.406
cldnh
-0.060
XLOC-006827
0.321
rtn1a
-0.059
si:ch211-132g1.6
0.256
si:ch211-196l7.4
-0.053
si:dkeyp-51f12.3
0.242
elavl3
-0.053
BX005085.7
0.226
tuba1c
-0.053
slc12a10.2
0.223
gabarapb
-0.051
si:ch211-37e10.1
0.215
vamp2
-0.051
CABZ01112049.1
0.214
calm1a
-0.050
LOC110438274
0.197
atp6v1e1b
-0.049
si:ch211-113j14.1
0.195
h1f0
-0.046
LOC103911201
0.193
stmn1b
-0.046
CR376766.2
0.179
tuba1a
-0.046
si:dkey-79i2.4
0.174
ip6k2a
-0.045
CT573263.1
0.172
sncb
-0.045
LOC103908752
0.172
emc10
-0.045
XLOC-033951
0.172
tmem59
-0.045
znf831
0.168
cox8a
-0.045
pycr3
0.160
si:dkey-276j7.1
-0.044
fhdc4
0.153
calm2b
-0.044
sult5a1
0.150
insm1a
-0.044
si:dkey-9i23.6
0.149
atp5if1b
-0.043
LOC103908824
0.145
lamtor2
-0.043
LOC101884857
0.139
txn
-0.042
CABZ01040998.1
0.139
atp6ap2
-0.042
ednrab
0.138
mt-co2
-0.041
btr01
0.137
eml2
-0.041
BX248512.1
0.137
gabarapa
-0.040
sftpba
0.133
gnao1a
-0.040
BX936461.1
0.132
si:dkeyp-75h12.5
-0.040
LOC101883668
0.131
slc17a6b
-0.040
si:dkey-195m11.11
0.130
fam32a
-0.040
cyp2k19
0.130
flrt1b
-0.039
FP102167.1
0.130
histh1l
-0.039
LOC100536206
0.130
bdnf
-0.039