Daniocell
wu:fi36c02 (glial cells / spinal cord)
wu:fi36c02
ZFIN
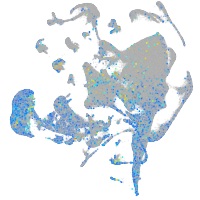
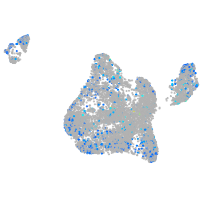
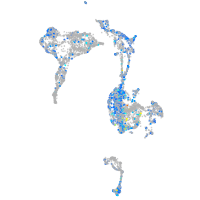
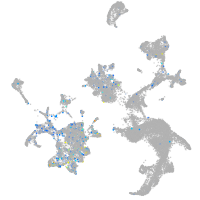
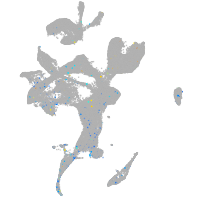
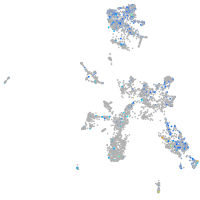
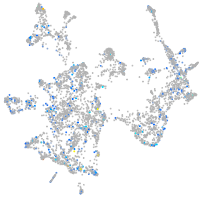
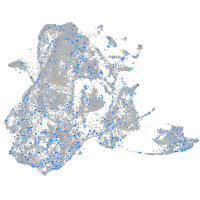
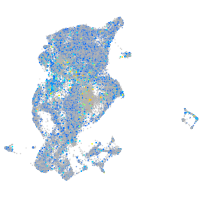
Gene expression UMAP
Display:
Expression
Stage
Other cell groups
all cells
blastomeres
PGCs
endoderm
axial mesoderm
muscle
mural cells /
non-skeletal muscle
mesenchyme
hematopoietic /
vasculature
pronephros
neural
spinal cord / glia
eye
taste / olfactory
otic / lateral line
epidermis
periderm
fin
ionocytes / mucous
pigment cells
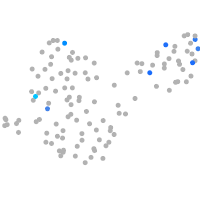
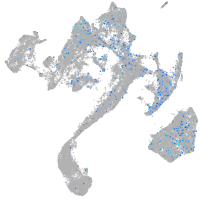
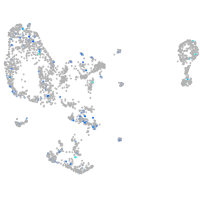
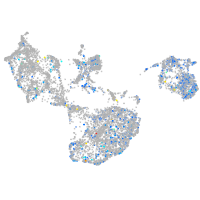
Expression by stage/cluster
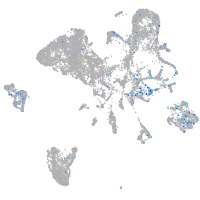
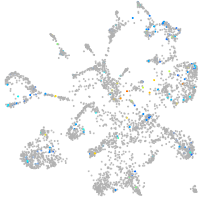
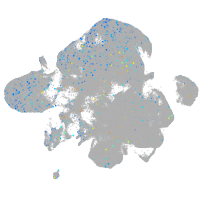
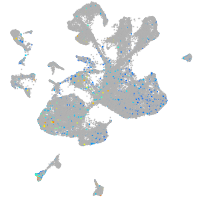
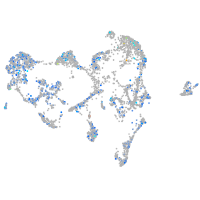
Correlated gene expression
Positive correlation
Negative correlation
Gene
r
Gene
r
si:dkey-200l5.4
0.167
ptmab
-0.071
crp1
0.164
hnrnpa0b
-0.065
cx47.1
0.154
tubb2b
-0.062
si:ch73-335m24.2
0.153
si:ch73-1a9.3
-0.062
cd9b
0.137
h3f3d
-0.060
cd226
0.134
hnrnpaba
-0.059
acta2
0.130
si:ch211-288g17.3
-0.057
cldnk
0.130
khdrbs1a
-0.057
mag
0.124
cirbpb
-0.057
elovl7a
0.122
hmgn2
-0.057
plp1b
0.121
hmgb1b
-0.056
ugt8
0.115
myt1b
-0.055
si:ch211-156j16.1
0.115
hmga1a
-0.054
elovl1b
0.111
h3f3a
-0.053
timd4
0.109
cirbpa
-0.053
tmem125b
0.108
hnrnpa0l
-0.051
si:dkey-164f24.2
0.108
hmgb3a
-0.051
hapln1b
0.106
tuba1c
-0.051
XLOC-013964
0.106
chd4a
-0.050
cdhr5a
0.105
nucks1a
-0.048
cd59
0.105
si:ch211-222l21.1
-0.048
si:ch211-165b10.3
0.105
tmsb
-0.047
CR936442.1
0.104
h2afvb
-0.045
tlcd1
0.102
syncrip
-0.045
si:dkey-204f11.64
0.102
syt2a
-0.044
clic2
0.099
si:ch73-386h18.1
-0.044
ppp1r14aa
0.099
tubb5
-0.044
tmbim1b
0.098
seta
-0.043
fabp2
0.097
nkain1
-0.043
mpz
0.095
marcksb
-0.043
myrf
0.095
si:dkey-280e21.3
-0.043
qki2
0.094
si:ch1073-429i10.3.1
-0.043
cldn19
0.094
rps12
-0.042
si:dkeyp-66d1.7
0.094
stxbp1a
-0.042
si:zfos-1011f11.2
0.093
si:ch211-57n23.4
-0.042