Daniocell
wu:fi09b08 (hematopoietic / vasculature)
wu:fi09b08
ZFIN
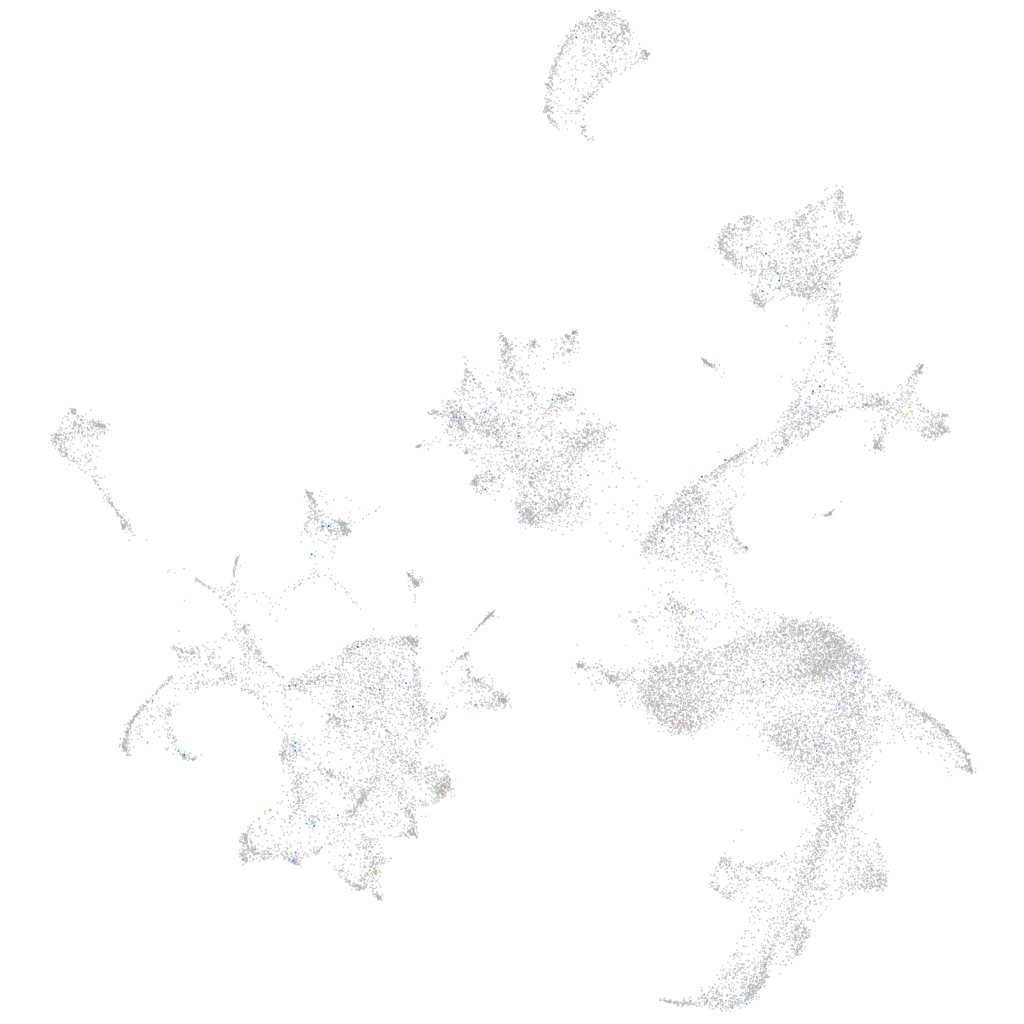
Gene expression UMAP
Display:
Expression
Stage
Other cell groups
all cells
blastomeres
PGCs
endoderm
axial mesoderm
muscle
mural cells /
non-skeletal muscle
mesenchyme
hematopoietic /
vasculature
pronephros
neural
spinal cord / glia
eye
taste / olfactory
otic / lateral line
epidermis
periderm
fin
ionocytes / mucous
pigment cells
Expression by stage/cluster
Correlated gene expression
Positive correlation
Negative correlation
Gene
r
Gene
r
LOC110439282
0.185
zgc:56095
-0.026
CR354549.8
0.153
slc25a3b
-0.024
XLOC-031211
0.142
prdx2
-0.023
taar18d
0.133
cahz
-0.019
taar20z
0.123
fam32a
-0.018
BX649490.1
0.114
tspo
-0.018
LOC103910423
0.107
uros
-0.018
LOC101883330
0.101
meaf6
-0.018
ccl27a
0.099
elocb
-0.018
si:zfos-2372e4.1
0.095
hbae5
-0.017
LOC103909738
0.094
mibp
-0.017
lmod3
0.092
oaz1b
-0.017
si:ch211-202m22.1
0.092
ube2g1a
-0.017
LOC103909461
0.091
ilf2
-0.017
XLOC-002233
0.088
vdac2
-0.017
igfals
0.087
eif3s6ip
-0.017
LOC100006699
0.082
hemgn
-0.017
si:dkeyp-115d7.2
0.080
tuba8l4
-0.017
si:ch211-165f21.2
0.080
hbbe1.3
-0.017
si:dkey-247i3.6
0.077
glrx5
-0.016
BX908804.1
0.076
fth1a
-0.016
ccr11.1
0.075
nmt1b
-0.016
crfb12
0.072
si:ch211-227m13.1
-0.016
CABZ01021599.1
0.071
mcl1a
-0.016
atad3
0.070
jak2a
-0.015
grpr
0.069
tdh
-0.015
CR626887.2
0.069
blvrb
-0.015
BX510909.1
0.068
ell2
-0.015
LOC103910873
0.068
hbae1.1
-0.015
LOC108192080
0.067
tal1
-0.015
kitlgb
0.066
tnnc2
-0.015
mttp
0.066
safb
-0.015
tmem125b
0.064
alas2
-0.015
rhol
0.063
pop7
-0.014
XLOC-025468
0.063
rfesd
-0.014