Daniocell
wu:fi09b08 (endoderm)
wu:fi09b08
ZFIN
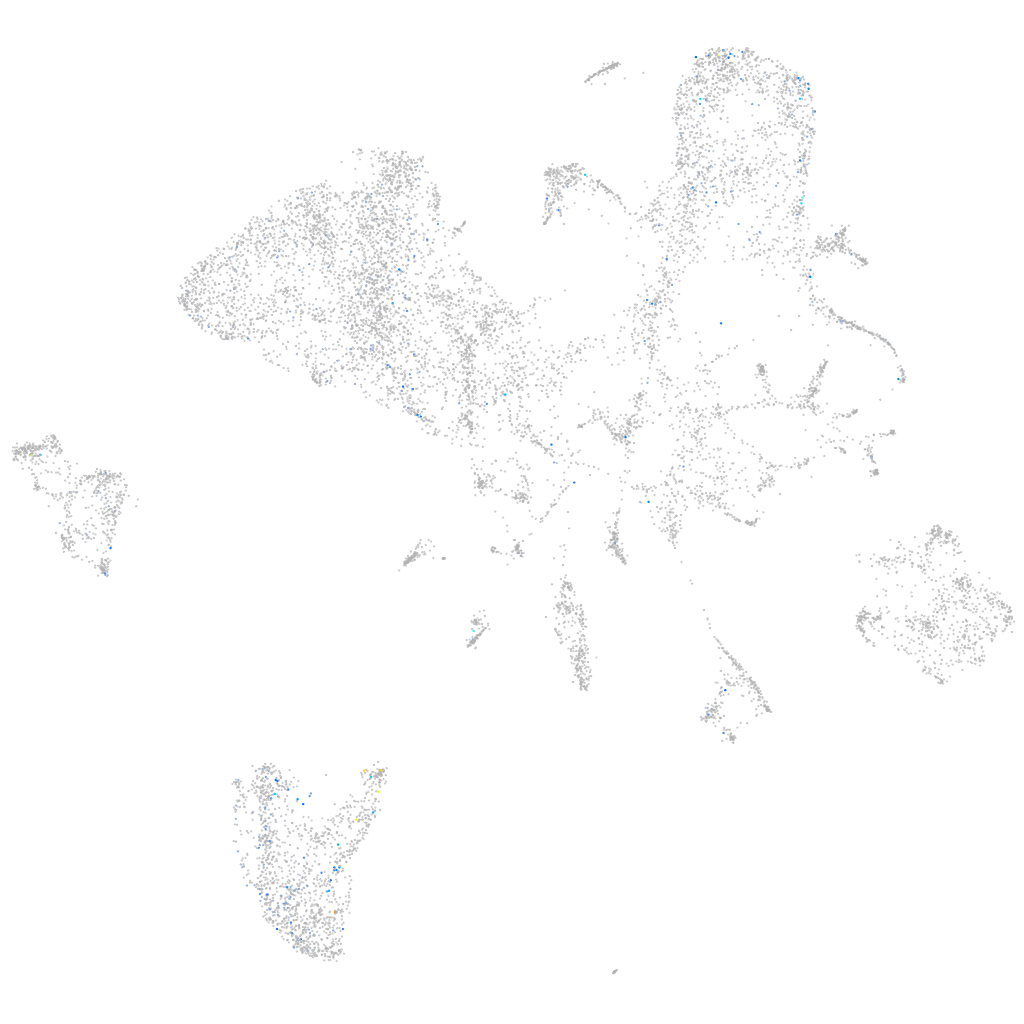
Gene expression UMAP
Display:
Expression
Stage
Other cell groups
all cells
blastomeres
PGCs
endoderm
axial mesoderm
muscle
mural cells /
non-skeletal muscle
mesenchyme
hematopoietic /
vasculature
pronephros
neural
spinal cord / glia
eye
taste / olfactory
otic / lateral line
epidermis
periderm
fin
ionocytes / mucous
pigment cells
Expression by stage/cluster
Correlated gene expression
Positive correlation
Negative correlation
Gene
r
Gene
r
LOC101883343
0.149
rps7
-0.072
LOC103910661
0.134
ran
-0.061
LOC108190067
0.128
hmgn7
-0.059
LOC108181502
0.122
ptmab
-0.058
LOC101886779
0.121
hmgn6
-0.058
zgc:158463
0.117
faua
-0.056
CABZ01052573.1
0.115
prdx5
-0.053
CT027638.1
0.113
fthl27
-0.052
si:ch73-44m9.5
0.112
ybx1
-0.051
LOC101886630
0.109
si:ch211-222l21.1
-0.051
BX548046.1
0.108
rps23
-0.051
XLOC-035750
0.104
sap18
-0.051
LOC103910008
0.103
rpl19
-0.050
CABZ01003056.1
0.101
si:ch73-281n10.2
-0.050
kif5ab
0.099
pcbp2
-0.050
tgm1l3
0.098
cox6b2
-0.050
LOC108182773
0.097
si:ch73-1a9.3
-0.049
spink4
0.096
slc25a5
-0.049
LOC108180719
0.094
hnrnpaba
-0.048
nt5c1ab
0.090
ptmaa
-0.048
sycn.2
0.088
arl6ip1
-0.048
cpa5
0.088
apoc1
-0.047
si:ch211-247l8.10
0.088
dnaja2a
-0.047
chrm2a
0.086
ubb
-0.047
CU639471.1
0.086
jpt1b
-0.047
ela3l
0.086
hsbp1b
-0.047
cpb1
0.085
marcksl1b
-0.047
si:ch211-240l19.6
0.085
rbm8a
-0.046
cel.2
0.085
rpl8
-0.046
si:rp71-62i8.1
0.085
sf3b6
-0.046
fep15
0.084
rpl17
-0.046
ela2l
0.083
hmga1a
-0.046
zgc:92137
0.083
hdac1
-0.045
LOC101886601.1
0.083
rsl24d1
-0.045
aftphb
0.082
hnrnpabb
-0.045