Daniocell
wdr11 (pronephros)
WD repeat domain 11
ZFIN
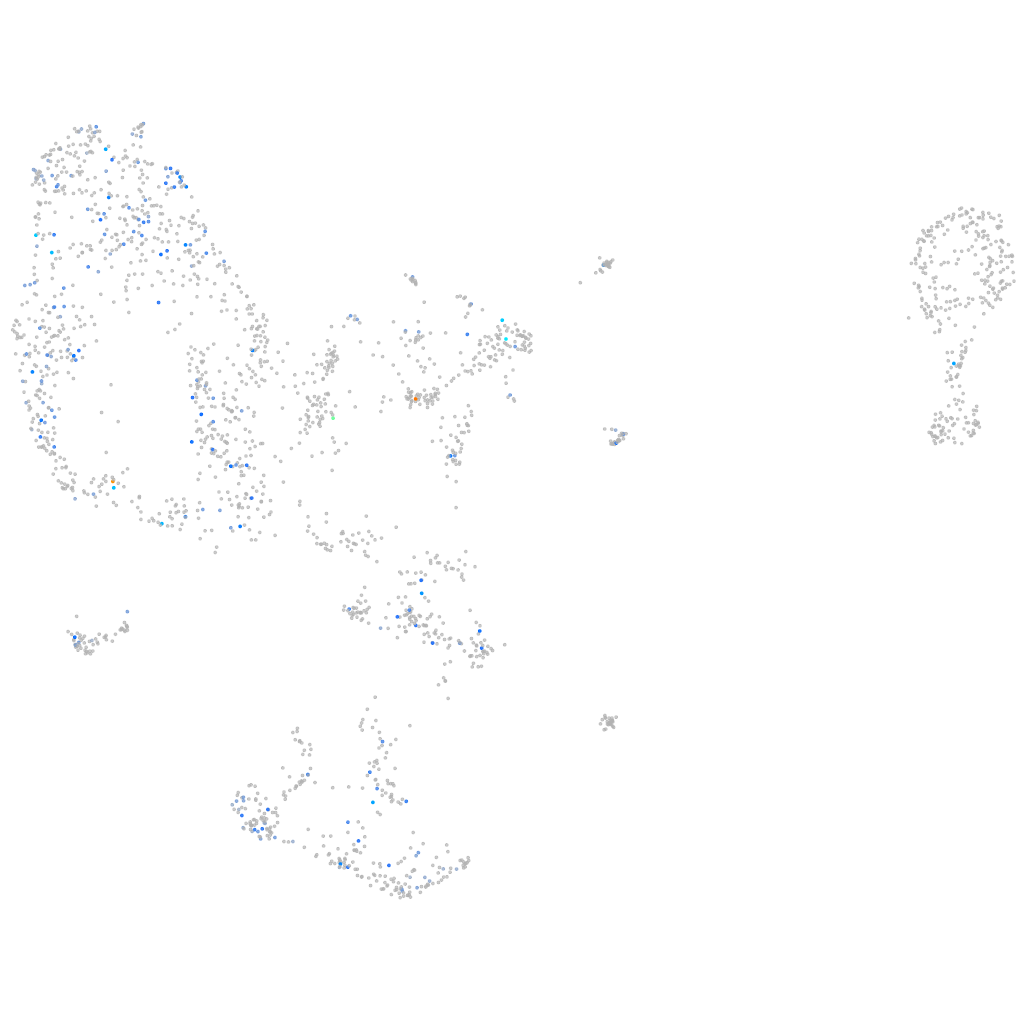
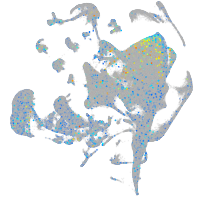
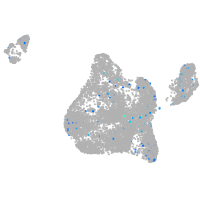
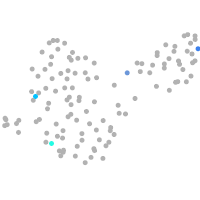
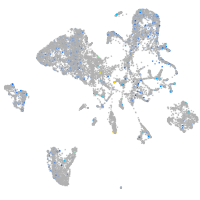
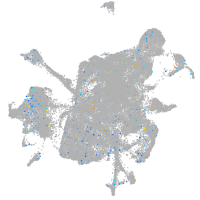
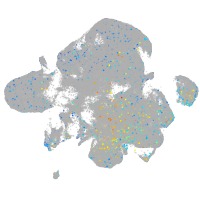
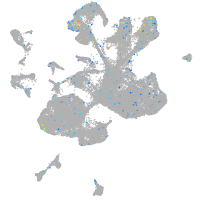
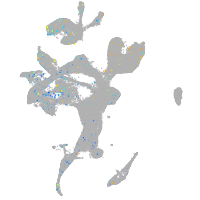
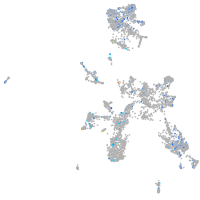
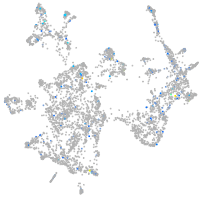
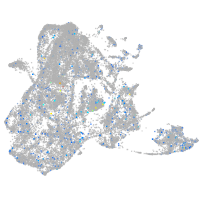
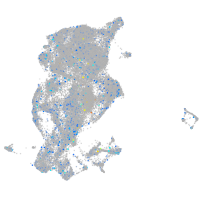
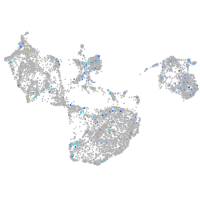
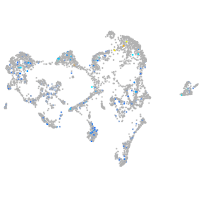
Gene expression UMAP
Display:
Expression
Stage
Other cell groups
all cells
blastomeres
PGCs
endoderm
axial mesoderm
muscle
mural cells /
non-skeletal muscle
mesenchyme
hematopoietic /
vasculature
pronephros
neural
spinal cord / glia
eye
taste / olfactory
otic / lateral line
epidermis
periderm
fin
ionocytes / mucous
pigment cells
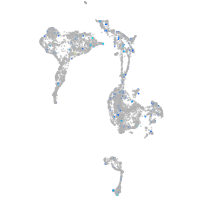
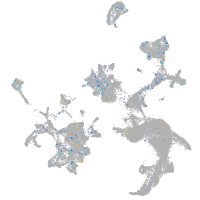
Expression by stage/cluster
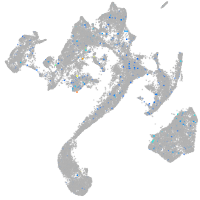
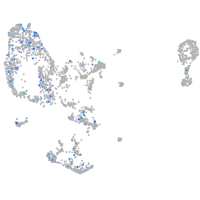
Correlated gene expression
Positive correlation
Negative correlation
Gene
r
Gene
r
gabbr1b
0.336
rps12
-0.111
LOC103909969
0.332
hnrnpaba
-0.109
LOC103909566
0.331
rps19
-0.100
si:dkeyp-68b7.12
0.321
hmgn6
-0.098
si:dkey-33c14.6
0.289
nop56
-0.098
LOC103910742
0.286
ilf3b
-0.096
impa2
0.269
setb
-0.094
BX530091.1
0.239
nucks1a
-0.094
XLOC-018968
0.239
cirbpa
-0.093
svep1
0.221
anp32a
-0.091
si:ch211-196f5.9
0.217
wu:fb97g03
-0.091
ttc39c
0.215
ptmab
-0.090
LOC110439934
0.215
hmgb2a
-0.090
hnrnpa3
0.212
npm1a
-0.090
LOC110438378
0.210
h3f3d
-0.089
CABZ01039304.1
0.207
si:ch211-217k17.7
-0.089
si:dkey-19a16.4
0.207
hnrnpa1b
-0.088
si:ch211-117k10.3
0.196
ncl
-0.088
si:ch211-51a6.2
0.188
marcksb
-0.088
ipo8
0.188
rsl1d1
-0.087
dusp23b
0.186
prmt1
-0.086
si:ch1073-358c10.1
0.186
hmgn7
-0.086
zgc:173624
0.181
dkc1
-0.085
grm3
0.180
seta
-0.085
XLOC-023704
0.180
hmga1a
-0.082
her11
0.179
hdac1
-0.081
si:ch73-362m14.4
0.178
marcksl1b
-0.080
mlxipl
0.178
hnrnpabb
-0.080
PRRG3
0.173
ddx18
-0.079
nagpa
0.166
hspb1
-0.079
ptprh
0.162
ebna1bp2
-0.078
irx4a
0.161
apoc1
-0.078
akt3a
0.160
anp32e
-0.076
smyd4
0.159
cbx3a
-0.076
anapc4
0.159
bms1
-0.076