Daniocell
wasb (otic / lateral line)
WASP actin nucleation promoting factor b
ZFIN
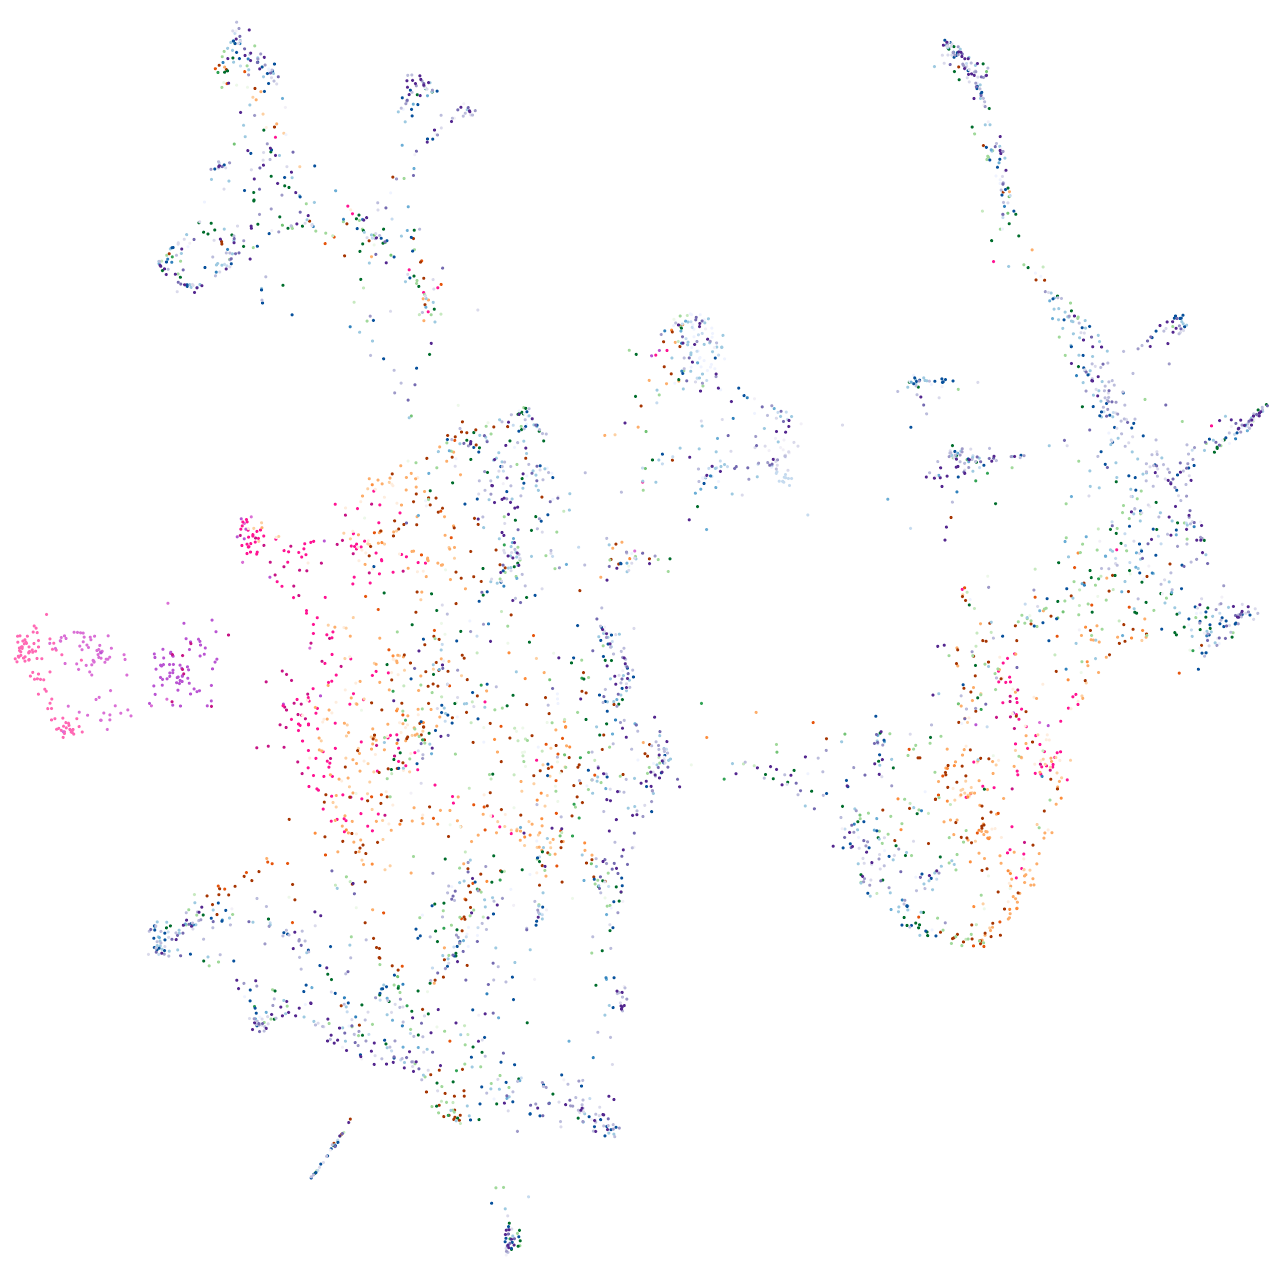
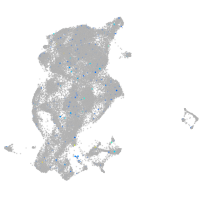
Gene expression UMAP
Display:
Expression
Stage
Other cell groups
all cells
blastomeres
PGCs
endoderm
axial mesoderm
muscle
mural cells /
non-skeletal muscle
mesenchyme
hematopoietic /
vasculature
pronephros
neural
spinal cord / glia
eye
taste / olfactory
otic / lateral line
epidermis
periderm
fin
ionocytes / mucous
pigment cells
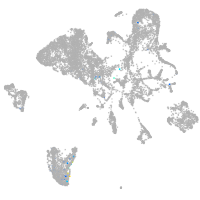
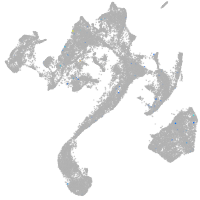
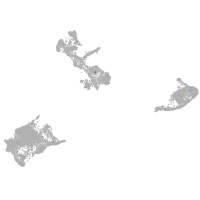
Expression by stage/cluster
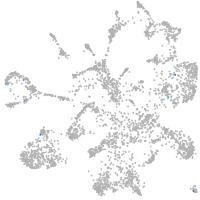
Correlated gene expression
Positive correlation
Negative correlation
Gene
r
Gene
r
lpar5a
0.342
ndufab1b
-0.038
CR855375.1
0.301
mrps11
-0.032
CR847503.2
0.282
pam16
-0.032
grap2b
0.273
adrm1
-0.031
XLOC-031373
0.265
lsm7
-0.031
CABZ01083778.1
0.262
hnrnpa1a
-0.030
si:dkey-62k3.6
0.260
zgc:56676
-0.030
rgs13
0.247
gpatch8
-0.030
CT573263.1
0.243
rab28
-0.029
zgc:165583
0.242
lsr
-0.029
il2rga
0.242
spata4
-0.029
irgf1
0.242
tle3a
-0.029
si:dkey-192k22.2
0.242
gatc
-0.029
CR786582.2
0.242
cdh2
-0.028
si:rp71-68n21.9
0.242
si:ch211-162e15.3
-0.028
tradv24.0.3
0.238
sarnp
-0.028
peak3
0.238
bin3
-0.027
rgs18
0.238
fosl2
-0.027
si:ch211-105n15.1
0.238
hsd17b7
-0.027
CABZ01074304.1
0.238
khdrbs1b
-0.027
CCKAR
0.237
ISCU (1 of many)
-0.027
scin
0.233
taf15
-0.027
si:dkey-88l16.3
0.224
isca2
-0.027
ms4a17a.6
0.222
apbb1
-0.027
spi2
0.220
mapre1b
-0.027
ccr9b
0.218
AL935174.5
-0.027
coro1a
0.215
bcl9
-0.027
lat
0.215
rabl2
-0.026
LOC103911288
0.213
hebp2
-0.026
LOC103910524
0.211
ndufa7
-0.026
rgs1
0.210
bcl2l10
-0.026
si:ch1073-110a20.3
0.210
fat1a
-0.026
trim35-25
0.210
hmox2b
-0.026
wasa
0.209
mrps2
-0.026
MYO1G
0.207
ivd
-0.026