Daniocell
vti1b (mural cells / non-skeletal muscle)
vesicle transport through interaction with t-SNAREs 1B
ZFIN
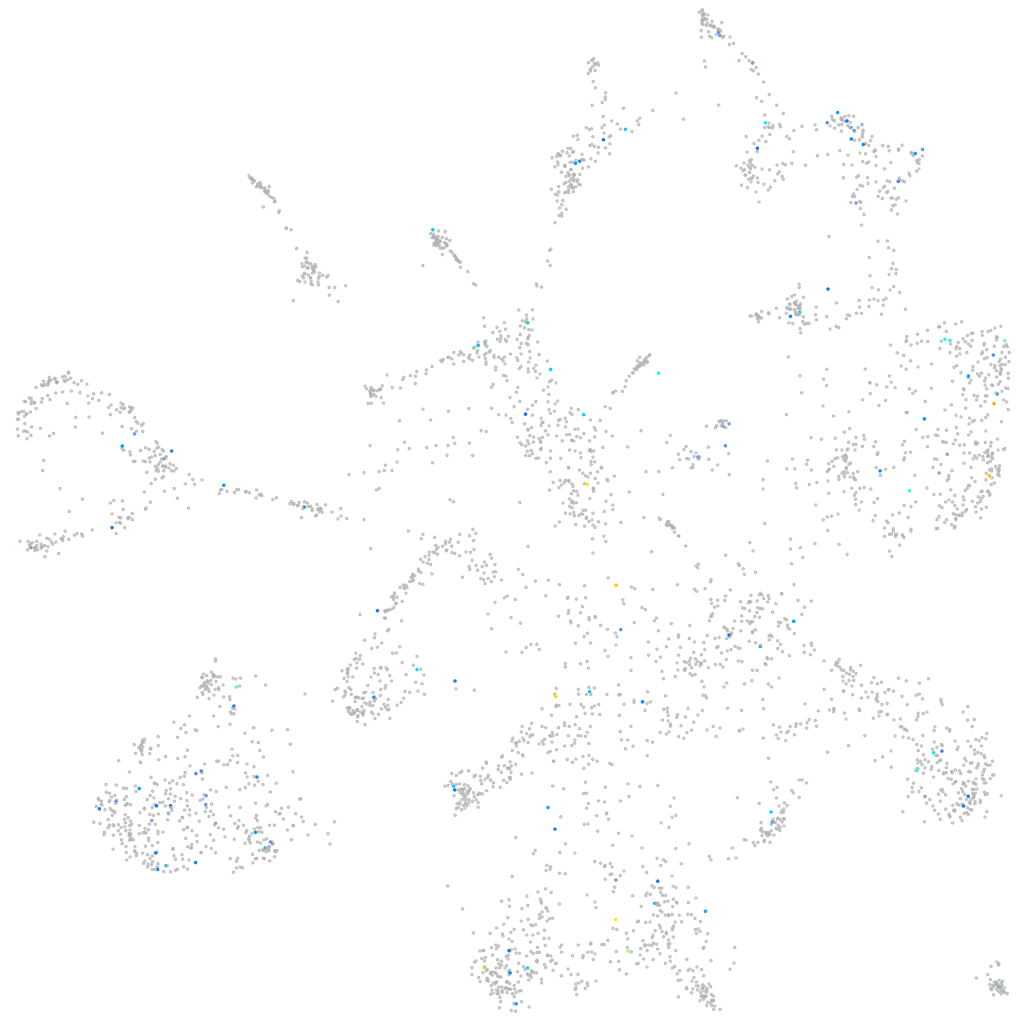
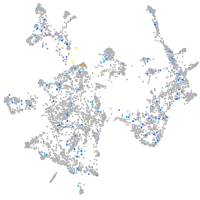
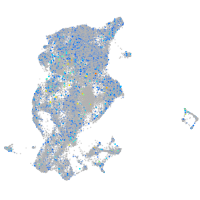
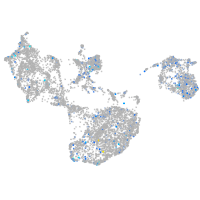
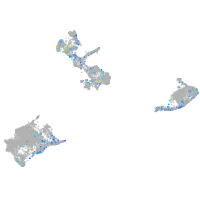
Gene expression UMAP
Display:
Expression
Stage
Other cell groups
all cells
blastomeres
PGCs
endoderm
axial mesoderm
muscle
mural cells /
non-skeletal muscle
mesenchyme
hematopoietic /
vasculature
pronephros
neural
spinal cord / glia
eye
taste / olfactory
otic / lateral line
epidermis
periderm
fin
ionocytes / mucous
pigment cells
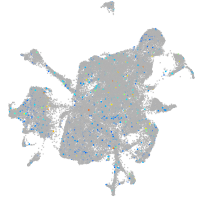
Expression by stage/cluster
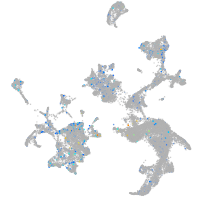
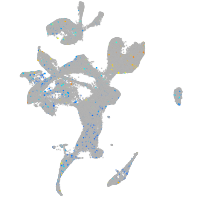
Correlated gene expression
Positive correlation
Negative correlation
Gene
r
Gene
r
CABZ01080006.1
0.218
mylpfa
-0.047
XLOC-014488
0.183
tmem51a
-0.039
LOC101884052
0.179
nme2b.2
-0.039
si:ch73-252i11.1
0.173
rps27a
-0.037
vwf
0.166
prkcsh
-0.036
nek11
0.166
rcan2
-0.035
proser2
0.159
capns1a
-0.035
cbln10
0.156
pvalb1
-0.035
crygm2d10
0.152
zfyve27
-0.035
or137-3
0.152
apoa2
-0.035
si:ch211-226o13.1
0.150
rgs5b
-0.034
cyp11c1
0.147
ndufa3
-0.034
CR356227.1
0.147
ric8b
-0.034
XLOC-013628
0.146
hexim1
-0.034
BX664618.1
0.143
rbp5
-0.033
XLOC-031177
0.136
plekhg2
-0.032
LOC100151145
0.133
cygb1
-0.032
CU062431.1
0.131
prss59.1
-0.031
CT573316.1
0.127
sub1b
-0.031
zdhhc15a
0.125
ttc3
-0.031
znf1100
0.124
gtpbp4
-0.031
il2rgb
0.123
tuba8l
-0.031
wu:fc30c06
0.122
rnaseh2c
-0.031
LOC110437839
0.120
map2k1
-0.030
LOC110440098
0.117
pvalb4
-0.030
XLOC-023211
0.116
senp7b
-0.030
uts2a
0.115
rab7a
-0.030
XLOC-006827
0.115
klf7b
-0.030
hdhd5
0.114
atad5a
-0.030
si:dkey-9i23.8
0.114
stox1
-0.030
si:ch73-330k17.3
0.114
snapc1b
-0.029
znf326
0.114
mcm5
-0.029
cyr61l2
0.114
plcb3
-0.029
si:ch73-97h19.2
0.114
tarbp2
-0.029
CU302321.1
0.113
txnrd3
-0.029